Essay
Consider Figure 14.7 below. Discuss the relationship between these two series, with particular attention to the Fisher equation.Figure 14.7: U.S. 10-Year Bond Yield and Inflation 2006-2010 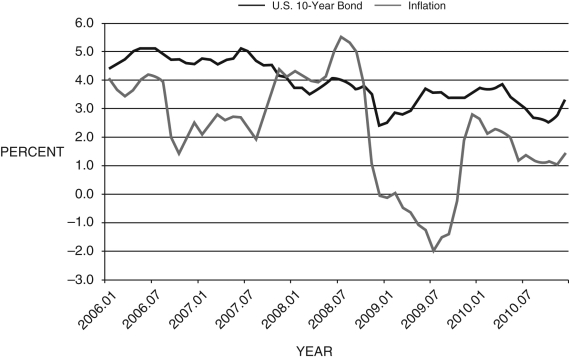
Correct Answer:

Verified
The Fisher equation is the relationship ...View Answer
Unlock this answer now
Get Access to more Verified Answers free of charge
Correct Answer:
Verified
View Answer
Unlock this answer now
Get Access to more Verified Answers free of charge
Q82: The high growth rates of money in
Q83: Figure 14.1: BAA and 10-Year Bonds, 2006-2010
Q84: Refer to the following figure when answering
Q85: The Squam Lake Group's reform suggestions included
Q86: P/E ratio stands for _ ratio.<br>A) price-earnings<br>B)
Q88: The burst of the housing bubble can
Q89: The Fed's balance sheet normally consists of:<br>A)
Q90: The effect of the subprime loan crisis
Q91: The event that likely caused the financial
Q92: Figure 14.1: BAA and 10-Year Bonds, 2006-2010