Multiple Choice
Refer to the following figure when answering the following questions.
Figure 5.4: Solow Diagram 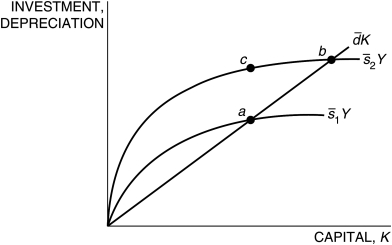
-Figure 5.4 represents two countries, 1 and 2. Country ________ has a higher saving rate and will have a ________ steady state than the other country.
A) 2; lower
B) 1; higher
C) 2; higher
D) 1; lower
E) Not enough information is given.
Correct Answer:

Verified
Correct Answer:
Verified
Q63: The equation <img src="https://d2lvgg3v3hfg70.cloudfront.net/TB6622/.jpg" alt="The equation
Q64: Refer to the following figure when answering
Q65: If we define the saving rate as
Q66: In the Solow model, defining <img src="https://d2lvgg3v3hfg70.cloudfront.net/TB6622/.jpg"
Q67: In the Solow model, if, in the
Q69: The productivity parameter, <img src="https://d2lvgg3v3hfg70.cloudfront.net/TB6622/.jpg" alt="The productivity
Q70: In the Solow model, if gross investment
Q71: The key difference between the Solow and
Q72: Assume a production function is given by
Q73: Figure 5.6 <img src="https://d2lvgg3v3hfg70.cloudfront.net/TB6622/.jpg" alt="Figure 5.6