Multiple Choice
Competition for resources occurs often within communities. The black line represents the change in fitness for one species, and the gray line represents the change in fitness for another species. Which of the following graphs represents the change in fitness when there is competition for the same resource? 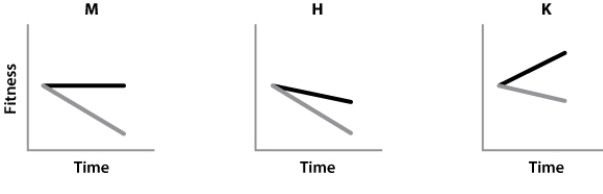
A) graph M
B) graph H
C) graph K
Correct Answer:

Verified
Correct Answer:
Verified
Q39: Consider the food web below. <img src="https://d2lvgg3v3hfg70.cloudfront.net/TB5080/.jpg"
Q40: Disturbances:<br>A)involve interactions such as competition and predation.<br>B)affect
Q41: Niches are dynamic, and are affected by
Q42: _ can have similar effects on population
Q43: What is the difference between evolution and
Q45: In a successional community, some kinds of
Q46: Over the winter the hibiscus plants in
Q47: When sea otters are present in a
Q48: Measuring its costs and benefits in terms
Q49: Measuring its costs and benefits in terms