Multiple Choice
Which of the graphs below would likely represent the distribution of a complex trait? 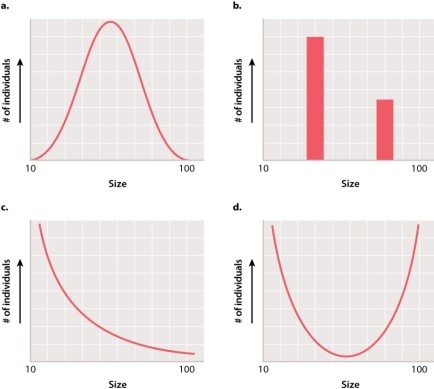
A) graph A
B) graph B
C) graph C
D) graph D
Correct Answer:

Verified
Correct Answer:
Verified
Related Questions
Q2: Twin studies have been used to assess
Q3: In a parent-offspring regression experiment, suggest a
Q4: If all of the variation in a
Q5: Consider a trait determined entirely by three
Q6: A key difference between single gene traits
Q7: Which of the following statements is TRUE
Q8: After reviewing the graph below, one could
Q9: When heritability is 100%, the environment plays:<br>A)no
Q10: A small difference between the concordance rates
Q11: In a study of concordance, a sample