Multiple Choice
In a parent-offspring regression experiment, suggest a hypothesis that could explain the solid line in the following graph. 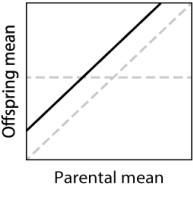
A) The offspring have a "worse" environment than the parents did.
B) The offspring have a "better" environment than the parents did.
C) The trait has a heritability that is less than 0.
D) The trait has a heritability that is greater than 1.
E) None of the answer options is correct.
Correct Answer:

Verified
Correct Answer:
Verified
Q113: In general, the phenotypes of a complex
Q114: A new mutation arises that affects a
Q115: When considering complex traits in health and
Q116: Inbred lines of animals, such as laboratory
Q117: Although more than 50 genes contribute to
Q119: One day, scientists will be able to
Q120: Which of the traits depicted here has
Q121: The graph here shows the results of
Q122: Name one drawback of personalized medicine, though
Q123: In the graph of Galton's height data