Multiple Choice
In the graph of Galton's height data below, which line on the graph represents the average height of the parents in a mating? 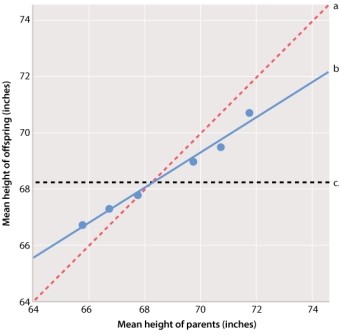
A) line a
B) line b
C) line c
Correct Answer:

Verified
Correct Answer:
Verified
Related Questions
Q118: In a parent-offspring regression experiment, suggest a
Q119: One day, scientists will be able to
Q120: Which of the traits depicted here has
Q121: The graph here shows the results of
Q122: Name one drawback of personalized medicine, though
Q124: Sometimes a fertilized egg, after a few
Q125: Genetic mapping of inherited risk factors that
Q126: Consider a trait determined by a rare,
Q127: The plots shown here depict several possible
Q128: Down syndrome, the most common type of