Multiple Choice
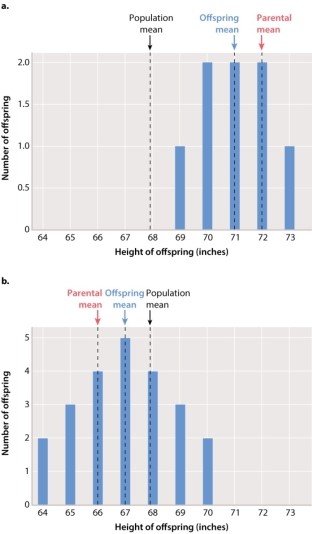
Francis Galton, a contemporary of Charles Darwin, studied variation in complex traits such as human height. Use the bar graphs shown below to answer the following question: Which of the following statements BEST describes graph (a) , which depicts Galton's data showing distribution of offspring height from the tallest parents he studied? 
A) The parental mean for the tallest parents is larger than the mean height of their offspring.
B) The parental mean for the tallest parents is smaller than the mean height of their offspring.
C) The average height of the offspring from the tallest parents is not related to the average height of their parents.
D) The average height of the tallest parents is not much more than the population mean height.
Correct Answer:

Verified
Correct Answer:
Verified
Q124: Sometimes a fertilized egg, after a few
Q125: Genetic mapping of inherited risk factors that
Q126: Consider a trait determined by a rare,
Q127: The plots shown here depict several possible
Q128: Down syndrome, the most common type of
Q130: As many as two-thirds of the American
Q131: The data in the table below
Q132: Traits that are influenced by multiple genes
Q133: Which of the following birth anomalies are
Q134: Traits such as human height, blood pressure,