Multiple Choice
The plots shown here depict several possible outcomes of an experiment comparing the mean phenotype of a behavioral trait in two strains of mice in three environments. Strain 1 is represented by filled circles and Strain 2 is represented by open circles. Environment 1 (E1) is deficient in stimulation for the behavior, environment 2 (E2) has an average level of stimulation, and environment 3 (E3) is enriched in stimulation. Which of the possible results indicates the presence of genotype-by-environment interaction for one or both of the strains? 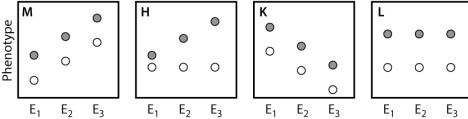
A) result M
B) result H
C) result K
D) result L
E) None of the answer options is correct.
Correct Answer:

Verified
Correct Answer:
Verified
Q122: Name one drawback of personalized medicine, though
Q123: In the graph of Galton's height data
Q124: Sometimes a fertilized egg, after a few
Q125: Genetic mapping of inherited risk factors that
Q126: Consider a trait determined by a rare,
Q128: Down syndrome, the most common type of
Q129: Francis Galton, a contemporary of Charles Darwin,
Q130: As many as two-thirds of the American
Q131: The data in the table below
Q132: Traits that are influenced by multiple genes