Essay
A quality analyst wants to construct a sample mean chart for controlling a packaging process.He knows from past experience that the process standard deviation is two ounces.Each day last week,he randomly selected four packages and weighed each.The data from that activity appear below.
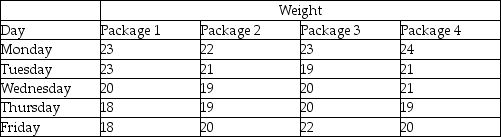 (a)Calculate all sample means and the mean of all sample means.
(b)Calculate upper and lower 2-sigma x-bar chart control limits that allow for natural variations.
(c)Based on the x-bar chart,is this process in control?
Correct Answer:

Verified
(a)The five sample means are 23,21,20,19...View Answer
Unlock this answer now
Get Access to more Verified Answers free of charge
Correct Answer:
Verified
View Answer
Unlock this answer now
Get Access to more Verified Answers free of charge
Q7: A retail store manager is trying to
Q12: A Type I error occurs when:<br>A)a good
Q24: An operator trainee is attempting to monitor
Q87: A nationwide parcel delivery service keeps track
Q113: A manager wants to build 3-sigma x-bar
Q119: Some degree of variability is present in
Q129: The mean and standard deviations for a
Q139: A(n) _ is a graph that describes
Q150: In most acceptance sampling plans, when a
Q240: The number of late insurance claim payouts