Essay
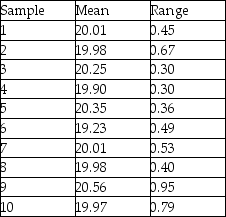
Ten samples of size four were taken from a process,and their weights measured.The sample averages and sample ranges are in the following table.Construct and plot an x-bar and R-chart using this data.Is the process in control?
Correct Answer:

Verified
 The x-bar chart is out of co...
View Answer
Unlock this answer now
Get Access to more Verified Answers free of charge
Correct Answer:
Verified
View Answer
Unlock this answer now
Get Access to more Verified Answers free of charge
Q53: Acceptance sampling<br>A) is the application of statistical
Q62: Which of the following statements about acceptance
Q69: A Cpk index of 1.00 equates to
Q69: If <img src="https://d2lvgg3v3hfg70.cloudfront.net/TB4044/.jpg" alt="If =
Q82: The _ is the percent defective in
Q98: When a lot has been accepted by
Q124: A local manufacturer supplies you with parts,
Q140: A lot that is accepted by acceptance
Q143: An acceptance sampling plan's ability to discriminate
Q145: A manufacturer uses statistical process control to