Essay
A quality analyst wants to construct a sample mean chart for controlling a packaging process.He knows from past experience that the process standard deviation is two ounces.Each day last week,he randomly selected four packages and weighed each.The data from that activity appear below.
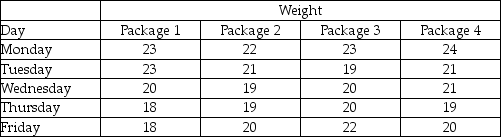 (a)Calculate all sample means and the mean of all sample means.
(b)Calculate upper and lower 2-sigma x-bar chart control limits that allow for natural variations.
(c)Based on the x-bar chart,is this process in control?
Correct Answer:

Verified
(a)The five sample means are 23,21,20,19...View Answer
Unlock this answer now
Get Access to more Verified Answers free of charge
Correct Answer:
Verified
View Answer
Unlock this answer now
Get Access to more Verified Answers free of charge
Q17: What is the difference between natural and
Q21: Plots of sample ranges indicate that the
Q37: The _-chart is the chief way to
Q40: If a sample of items is taken
Q43: A process range chart illustrates the amount
Q48: An x-bar chart is used when we
Q139: A(n) _ is a graph that describes
Q140: Ten samples of a process measuring the
Q222: A local manufacturer supplies you with parts,
Q256: A p-chart is appropriate to plot the