Essay
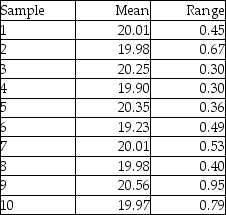
Ten samples of size four were taken from a process,and their weights measured.The sample averages and sample ranges are in the following table.Construct and plot an x-bar and R-chart using these data.Is the process in control?
Correct Answer:

Verified
 The x-bar chart is out of co...
View Answer
Unlock this answer now
Get Access to more Verified Answers free of charge
Correct Answer:
Verified
View Answer
Unlock this answer now
Get Access to more Verified Answers free of charge
Q16: A process is operating in such a
Q29: What is the AOQ of an acceptance
Q31: A department chair wants to monitor the
Q103: The higher the process capability ratio,the greater
Q104: The _ is a quality control chart
Q110: Why do range charts exist? Aren't x-bar
Q121: Averages of small samples,not individual measurements,are generally
Q124: An acceptance sampling plan's ability to discriminate
Q129: A normal distribution is generally described by
Q229: A run test is used:<br>A) to examine