Multiple Choice
Table 7.1 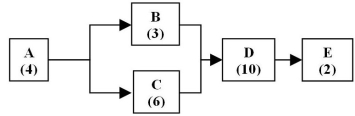 The figure above shows the call routing process for a customer service call center.Incoming calls are routed,depending on the complexity of the caller's request.Simple request are routed to work center B,while the more complex calls are routed to work center C (which also takes simple calls when not busy) .The numbers in parentheses are the time in minutes for each step of the process.
-Use the information in Table 7.1.Where would you expect customer wait times to occur?
A) D only
B) C and D
C) A only
D) E only
Correct Answer:

Verified
Correct Answer:
Verified
Q62: Given the following data about an assembly
Q63: Table 7.6<br>Burdell Industries makes four different models
Q65: _ is the maximum rate of output
Q66: Balance the assembly line for the tasks
Q68: Table 7.9<br>Balance the following line for an
Q71: Use the process flow diagram to determine
Q72: Table 7.8<br>King Supply makes four different types
Q82: _ is a planning and control system
Q98: Work should be released into the system
Q125: Consider consecutive processes A-B-C, where process A