Multiple Choice
The following figure shows the demand and cost curves facing a firm with market power in the short run. 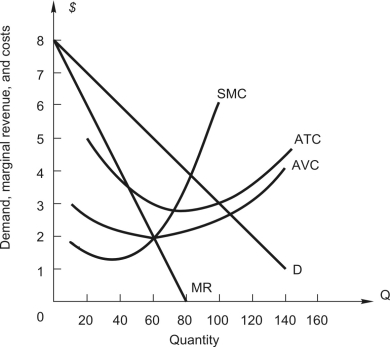 The profit-maximizing level of output is
A) 60 units.
B) 70 units
C) 80 units
D) 90 units.
E) 100 units.
Correct Answer:

Verified
Correct Answer:
Verified
Q20: Refer to the following figure showing demand
Q21: A price-setting firm faces the following estimated
Q22: monopolistic competitor is similar to a monopolist
Q23: Using time-series data,the demand function for a
Q24: If demand is estimated to be <img
Q26: The market demand for a monopoly firm
Q27: <img src="https://d2lvgg3v3hfg70.cloudfront.net/TB2562/.jpg" alt=" The figure above
Q28: The market demand for a monopoly firm
Q30: <img src="https://d2lvgg3v3hfg70.cloudfront.net/TB2562/.jpg" alt=" The figure above
Q100: A firm with market power will maximize