Multiple Choice
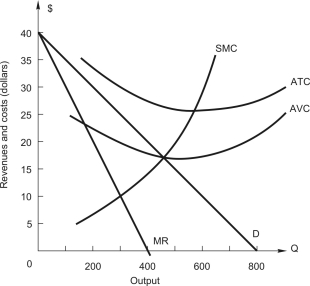 The figure above shows the demand and cost curves facing a price-setting firm.At what output is marginal revenue $20?
A) 100 units
B) 200 units
C) 300 units
D) 400 units
E) 500 units
Correct Answer:

Verified
Correct Answer:
Verified
Related Questions
Q25: The following figure shows the demand and
Q26: The market demand for a monopoly firm
Q27: <img src="https://d2lvgg3v3hfg70.cloudfront.net/TB2562/.jpg" alt=" The figure above
Q28: The market demand for a monopoly firm
Q29: A radio manufacturer has two plants --
Q33: A firm with two plants,A and B,has
Q34: The market demand for a monopoly firm
Q35: <img src="https://d2lvgg3v3hfg70.cloudfront.net/TB2562/.jpg" alt=" The figure above
Q62: A firm with two factories,one in Michigan
Q100: A firm with market power will maximize