Multiple Choice
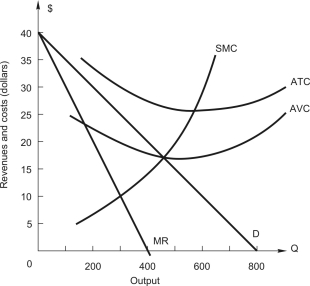 The figure above shows the demand and cost curves facing a price-setting firm.In profit-maximizing or loss-minimizing) equilibrium,the Lerner index is _____,and the elasticity of demand is ______.
A) 1 ;-1
B) 0.6; -1.667
C) 0.5; -2.0
D) 0.667; -1.5
E) 1.33; -0.75
Correct Answer:

Verified
Correct Answer:
Verified
Q29: A radio manufacturer has two plants --
Q30: <img src="https://d2lvgg3v3hfg70.cloudfront.net/TB2562/.jpg" alt=" The figure above
Q30: A monopolist will<br>A)always charge a price higher
Q33: A firm with two plants,A and B,has
Q34: The market demand for a monopoly firm
Q36: A firm with two plants,A and B,has
Q37: Refer to the following table that gives
Q40: Refer to the following table which gives
Q42: A firm with two factories,one in Michigan
Q62: A firm with two factories,one in Michigan