Multiple Choice
The graph below on the left shows the short-run marginal cost curve for a typical firm selling in a perfectly competitive industry.The graph on the right shows current industry demand and supply. 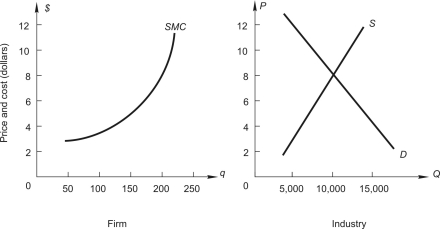 What output should the firm produce?
A) 200
B) 250
C) 150
D) 300
Correct Answer:

Verified
Correct Answer:
Verified
Q4: Which of the following is NOT a
Q17: Which of the following CANNOT be true
Q52: Suits Only,a dry cleaning firm that specializes
Q54: Total cost schedule for a competitive firm:
Q56: Below,the graph on the left shows long-run
Q58: The graph below shows demand and marginal
Q60: Consider a competitive industry and a price-taking
Q62: Below,the graph on the left shows long-run
Q81: Firms that employ exceptionally productive resources<br>A)have lower
Q97: Firm A and firm B both have