Multiple Choice
The graph below shows demand and marginal cost for a perfectly competitive firm.If the firm is producing 100 units of output,increasing output by one unit would ______ the firm's profit by $______. 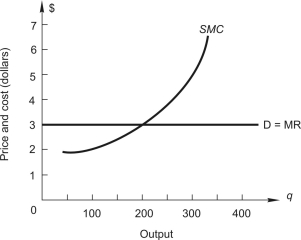
A) increase,$3
B) increase,$2
C) decrease,$1
D) increase,$1
E) decrease,$2
Correct Answer:

Verified
Correct Answer:
Verified
Q4: Which of the following is NOT a
Q17: Which of the following CANNOT be true
Q54: Total cost schedule for a competitive firm:
Q56: Below,the graph on the left shows long-run
Q57: The graph below on the left shows
Q60: Consider a competitive industry and a price-taking
Q62: Below,the graph on the left shows long-run
Q81: Firms that employ exceptionally productive resources<br>A)have lower
Q93: In a competitive industry the market-determined price
Q97: Firm A and firm B both have