Essay
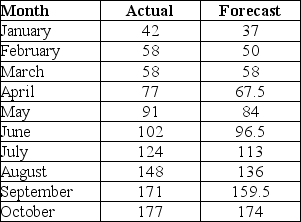
Ten months of data and the forecasts for those same periods are in the table below.Use mean bias,MAD,and MAPE to analyze the accuracy of the forecasts.
Correct Answer:

Verified
 Bias = 7....
View Answer
Unlock this answer now
Get Access to more Verified Answers free of charge
Correct Answer:
Verified
View Answer
Unlock this answer now
Get Access to more Verified Answers free of charge
Q4: Focus forecasting selects the best forecast from
Q42: In an exponential smoothing model a _
Q47: The Bahouth Company wants to develop a
Q49: A linear regression model is developed that
Q69: One of the basic time series patterns
Q79: A systematic increase or decrease in the
Q100: Table 8.9<br>Consider the following results from the
Q105: Table 8.9<br>Consider the following results from the
Q111: Table 8.9<br>Consider the following results from the
Q119: Aggregating products or services together generally decreases