Multiple Choice
Table 5.11
Factors for Calculating Three-Sigma Limits for the  Chart and R-Chart
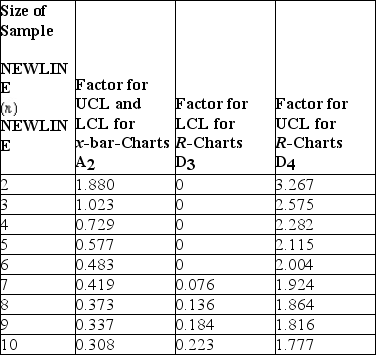 Source: 1950 ASTM Manual on Quality Control of Materials,copyright American Society for Testing Materials.Reprinted with permission.
-Thermostats are subjected to rigorous testing before they are shipped to air conditioning technicians around the world.Results from the last five samples are shown in the table.Calculate control limits for a chart that will monitor performance to target.The correct control limits as (LCL,UCL) are: 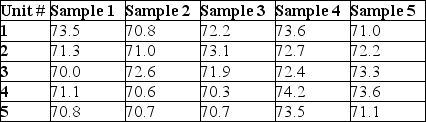
A) (70.46,73.39)
B) (68.94,74.89)
C) (69.71,74.14)
D) (69.80,74.05)
Correct Answer:

Verified
Correct Answer:
Verified
Q2: A laser eye surgery process has tolerances
Q8: The 15-year-old car didn't dazzle students or
Q10: A sampling plan is best for evaluating
Q20: The defect rate for a product has
Q51: A company is interested in monitoring the
Q85: A prime example of an internal failure
Q101: When should complete inspection be used?<br>A) when
Q134: A firm targeting Six Sigma quality will
Q172: The customer's assessment of quality with reference
Q180: A hotel tracks the number of complaints