Multiple Choice
Table 5.11
Factors for Calculating Three-Sigma Limits for the  Chart and R-Chart
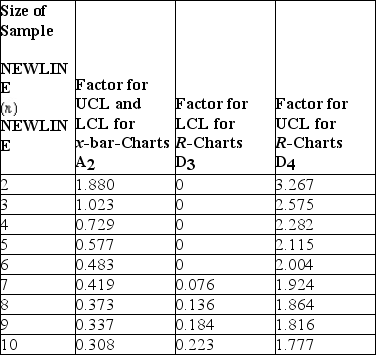 Source: 1950 ASTM Manual on Quality Control of Materials,copyright American Society for Testing Materials.Reprinted with permission.
-Thermostats are subjected to rigorous testing before they are shipped to air conditioning technicians around the world.Results from the last five samples are shown in the table.Create control charts that will fully monitor the process and indicate the result of X-bar and R chart analysis. 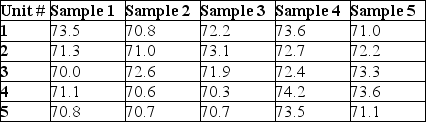
A) x bar and r chart are both out of control
B) x bar chart is in control but r chart is out of control
C) x bar chart is out of control but r chart is in control
D) x bar and r chart are both in control
Correct Answer:

Verified
Correct Answer:
Verified
Q1: Which of the following would be a
Q53: What are any three dimensions of quality
Q82: Consumers consider five aspects when defining quality.
Q123: An operator of a filling machine plotted
Q151: Since an employee's responsibility is to move
Q176: A process with a target of 25
Q176: A metal-cutting operation has a target value
Q177: Historically,the average time to service a customer
Q184: Table 5.11<br>Factors for Calculating Three-Sigma Limits for
Q185: Thermostats are subjected to rigorous testing before