Multiple Choice
Table 5.11
Factors for Calculating Three-Sigma Limits for the  Chart and R-Chart
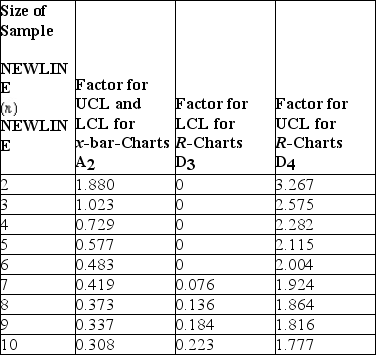 Source: 1950 ASTM Manual on Quality Control of Materials,copyright American Society for Testing Materials.Reprinted with permission.
-Thermostats are subjected to rigorous testing before they are shipped to air conditioning technicians around the world.Results from the last five samples are shown in the table.Calculate control limits for a chart that will monitor process consistency.The correct control limits as (LCL,UCL) are: 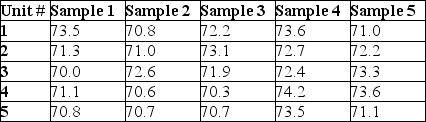
A) (-5.37,5.37)
B) (0.00,5.37)
C) (0.00,6.03)
D) (0.00,6.12)
Correct Answer:

Verified
Correct Answer:
Verified
Q1: Which of the following would be a
Q80: Table 5.4<br>The manager of Champion Cooling Company
Q82: Consumers consider five aspects when defining quality.
Q135: When considering the plan-do-study-act cycle for problem
Q151: Since an employee's responsibility is to move
Q173: What are the benefits of ISO certification?
Q176: A metal-cutting operation has a target value
Q180: Table 5.11<br>Factors for Calculating Three-Sigma Limits for
Q185: Thermostats are subjected to rigorous testing before
Q187: Construct 3 control charts using the data