Multiple Choice
Construct 3 control charts using the data in the table.What conclusions can you draw about the state of control for this process? 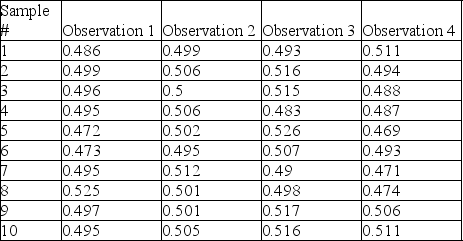
A) X bar chart is out of control but the R-chart is in control
B) the X bar chart is out of control and the R chart is also out of control
C) the X bar chart and the R chart are both in control
D) the X bar chart is in control but the R chart is out of control
Correct Answer:

Verified
Correct Answer:
Verified
Q19: At which of the following steps will
Q29: Wider limits on a control chart result
Q80: Table 5.4<br>The manager of Champion Cooling Company
Q135: When considering the plan-do-study-act cycle for problem
Q151: Since an employee's responsibility is to move
Q173: What are the benefits of ISO certification?
Q176: A metal-cutting operation has a target value
Q179: The advantage of variable measurements is that
Q184: Table 5.11<br>Factors for Calculating Three-Sigma Limits for
Q185: Thermostats are subjected to rigorous testing before