Essay
The break-even graph shown below represents the cost structure associated with a flexible production process and one that is fixed (less flexible).Using the information displayed in the graph,determine the cost structures associated with the two alternative production methods. 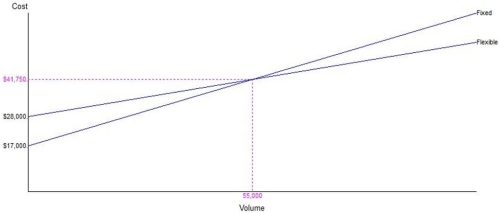
Correct Answer:

Verified
The Fixed alternative has a fixed cost o...View Answer
Unlock this answer now
Get Access to more Verified Answers free of charge
Correct Answer:
Verified
View Answer
Unlock this answer now
Get Access to more Verified Answers free of charge
Q2: Process _ is the boundary of the
Q2: A front office structure features high levels
Q6: Capital intensive automation is appropriate for high
Q17: Benchmarking studies must have:<br>A) a direct competitor
Q20: A(n) _ process would probably not be
Q143: Sketch and discuss the product-process matrix for
Q172: Process analysis is the documentation and detailed
Q182: A farmer that has been well-trained in
Q188: When managing processes, it is vital that:<br>A)
Q238: Scenario 2.3<br>A job consists of three elements.