Essay
A quality analyst wants to construct a sample mean chart for controlling a packaging process.He knows from past experience that the process standard deviation is two ounces.Each day last week,he randomly selected four packages and weighed each.The data from that activity appears below. 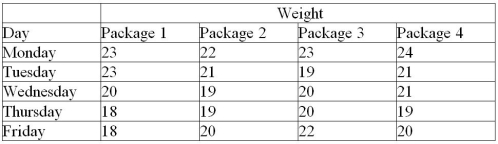 (a)Calculate all sample means and the mean of all sample means.
(b)Calculate upper and lower control limits that allow for natural variations.
(c)Is this process in control?
Correct Answer:

Verified
(a)The five sample means are 23,21,20,19...View Answer
Unlock this answer now
Get Access to more Verified Answers free of charge
Correct Answer:
Verified
View Answer
Unlock this answer now
Get Access to more Verified Answers free of charge
Q16: A process is operating in such a
Q39: The mean and standard deviation for a
Q85: Natural variations:<br>A)affect almost every production process.<br>B)are the
Q97: Which of the following is true of
Q102: A city police chief decides to do
Q139: A car mechanic is thinking of guaranteeing
Q143: A quality analyst wants to construct a
Q153: A process that is assumed to be
Q163: A c-chart is appropriate to plot the
Q237: An operating characteristics curve shows:<br>A) upper and