Essay
A quality analyst wants to construct a sample mean chart for controlling a packaging process.He knows from past experience that when the process is operating as intended,packaging weight is normally distributed with a mean of twenty ounces,and a process standard deviation of two ounces.Each day last week,he randomly selected four packages and weighed each.The data from that activity appears below. 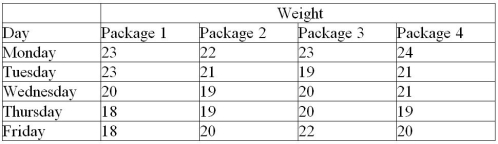 (a)If he sets an upper control limit of 21 and a lower control limit of 19 around the target value of twenty ounces,what is the probability of concluding that this process is out of control when it is actually in control?
(b)With the UCL and LCL of part a,what do you conclude about this process-is it in control?
Correct Answer:

Verified
(a)These control limits are one standard...View Answer
Unlock this answer now
Get Access to more Verified Answers free of charge
Correct Answer:
Verified
View Answer
Unlock this answer now
Get Access to more Verified Answers free of charge
Q16: A process is operating in such a
Q39: The mean and standard deviation for a
Q85: Natural variations:<br>A)affect almost every production process.<br>B)are the
Q97: Which of the following is true of
Q139: A car mechanic is thinking of guaranteeing
Q144: A quality analyst wants to construct a
Q152: A retail store manager is trying to
Q153: A process that is assumed to be
Q163: A c-chart is appropriate to plot the
Q237: An operating characteristics curve shows:<br>A) upper and