Multiple Choice
The following figure shows the demand curve ES, the average cost curve AC, the marginal cost curve MC, and the marginal revenue curve MR for a firm.
Figure 8-1
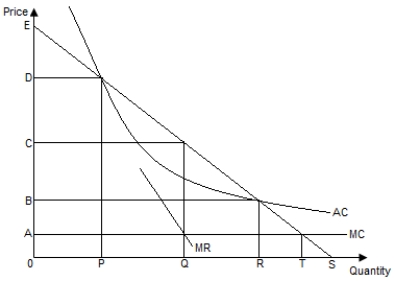
-Refer to Figure 8-1. Under average-cost pricing, the equilibrium price and output in the market are _____, respectively.
A) B and R
B) A and T
C) C and Q
D) D and P
E) A and Q
Correct Answer:

Verified
Correct Answer:
Verified
Q39: The following figure shows the demand curve
Q40: The following figure shows the demand curve
Q41: Carefully explain how short-run equilibrium and long-run
Q42: Many natural monopolies are regulated. Explain the
Q43: In the long run, monopolistically competitive firms:<br>A)
Q45: Industry demand is given by P =
Q46: Compare and contrast a monopolistically competitive firm
Q47: Which of the following is true of
Q48: Which of the following, if true, would
Q49: How can the quality of a product