Multiple Choice
The following figure shows the demand curve ES, the average cost curve AC, the marginal cost curve MC, and the marginal revenue curve MR for a firm.
Figure 8-1
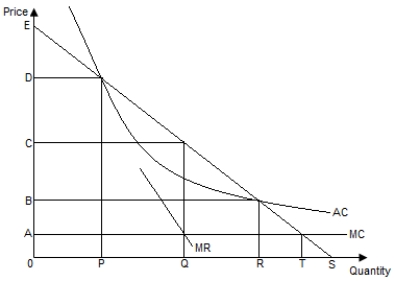
-Refer to Figure 8-1. If the regulator institutes marginal-cost pricing in the market, then:
A) MC = AC.
B) P = AC.
C) MR = MC.
D) P = MC > AC.
E) P = MC < AC.
Correct Answer:

Verified
Correct Answer:
Verified
Q34: Which of the following is a criticism
Q35: A monopolist faces the demand curve P
Q36: The demand for a good produced by
Q37: Unlike a pure monopoly firm, a monopolistically
Q38: Describe the different types of entry barriers
Q40: The following figure shows the demand curve
Q41: Carefully explain how short-run equilibrium and long-run
Q42: Many natural monopolies are regulated. Explain the
Q43: In the long run, monopolistically competitive firms:<br>A)
Q44: The following figure shows the demand curve