Exam 4: Individual and Market Demand
Exam 1: Preliminaries77 Questions
Exam 2: The Basics of Supply and Demand135 Questions
Exam 3: Consumer Behavior146 Questions
Exam 4: Individual and Market Demand173 Questions
Exam 5: Uncertainty and Consumer Behavior177 Questions
Exam 6: Production123 Questions
Exam 7: The Cost of Production166 Questions
Exam 8: Profit Maximization and Competitive Supply149 Questions
Exam 9: The Analysis of Competitive Markets177 Questions
Exam 10: Market Power: Monopoly and Monopsony158 Questions
Exam 11: Pricing With Market Power122 Questions
Exam 12: Monopolistic Competition and Oligopoly113 Questions
Exam 13: Game Theory and Competitive Strategy150 Questions
Exam 14: Markets for Factor Inputs123 Questions
Exam 15: Investment, Time, and Capital Markets153 Questions
Exam 16: General Equilibrium and Economic Efficiency111 Questions
Exam 17: Markets With Asymmetric Information130 Questions
Exam 18: Externalities and Public Goods123 Questions
Select questions type
The curve in the diagram below is called: 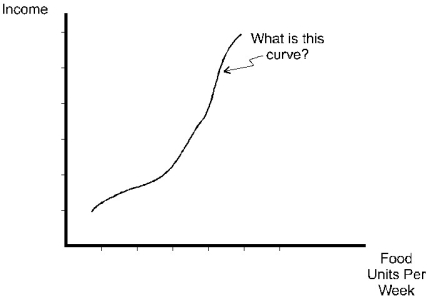
Free
(Multiple Choice)
4.9/5  (44)
(44)
Correct Answer: Verified
D
Which of these is an example of a negative network externality?
Free
(Multiple Choice)
4.8/5 (33)
Correct Answer:Verified
C
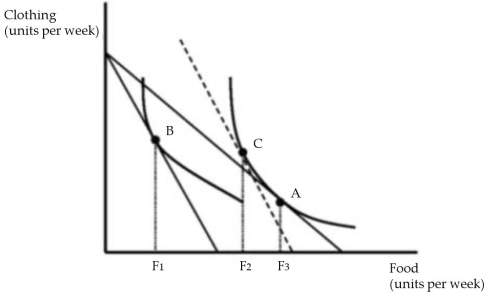 Figure 4.1
A consumer's original utility maximizing market basket of goods is shown in Figure 4.1 as point A. Following a price change, the consumer's utility maximizing market basket changes is at point B.
-Based on Figure 4.1, food is:
Figure 4.1
A consumer's original utility maximizing market basket of goods is shown in Figure 4.1 as point A. Following a price change, the consumer's utility maximizing market basket changes is at point B.
-Based on Figure 4.1, food is:
Free
(Multiple Choice)
5.0/5 (38)
Correct Answer:Verified
A
A consumer spends his income on food and rent. The government places a $1 tax on food. To restore the pre-tax consumption level of food the rebate paid to consumers will be smallest when
(Multiple Choice)
4.9/5 (34)
You have just won a cash award of $500 for academic excellence.
(Multiple Choice)
4.9/5 (30)
Assume that we have a demand curve of the form:
Log(Q) = a - b log(P) + c log(I)
Where Q = quantity, P = price, I = income, and a, b, and c are positive constants. The income and price elasticities for the demand curve represented above are always
(Multiple Choice)
4.8/5 (32)
Your income response for bicycle riding changes with the amount of income you earn. At low levels of income, you view bicycle riding as an inferior good and substitute other types of transportation (e.g., auto travel) as your income rises. However, you view bicycle riding as a normal good after your income rises above a particular level. What shape does your Engel curve for bicycle riding have?
(Multiple Choice)
4.9/5 (26)
Adriana is in charge of setting the price on basketball tickets for the local team's home games. From previous experience, she has estimated demand to be
P = 50 - 0.00166Q,
where P represents price in dollars per seat, and Q represents seats that could be sold per game. The seating capacity is 25,000 seats. Determine the number of tickets that would be sold at a ticket price of $15 each. Also, determine the consumer surplus that could be absorbed from these consumers if Adriana were able to set ticket prices so that each customer (who values the ticket at least at $15) pays the entirety of his or her actual valuation of the ticket.
(Essay)
4.9/5 (32)
Scenario 4.4:
The demand curve for the new computer game, Rock and Roll Trivia, is given as follows:
Q = 200 - 5P - .1Pc - .5Pd + .2A - I
where P is the price of the game
Pc is the price of a computer
Pd is the price of a diskette
A is the level of advertising
Q is the level of income
-See the information in Scenario 4.4. From this demand curve, one can infer that:
(Multiple Choice)
4.9/5 (34)
Scenario 4.3:
The demand for erasers (Q) is given as follows:
Q = 240 - 4Pe + 2I + Pb + A
where Pe is the price of erasers
I is the level of income
Pb is the price of another good
A is the level of advertising
Suppose that Q = 240, Pe = 10, Pb = 10, and A = 2.
-Given the information in Scenario 4.3, determine I.
(Multiple Choice)
4.9/5 (43)
Scenario 4.5:
The demand curve for grilled cheese sandwiches has been estimated using statistical techniques as follows:
log(Q) = -1.10 - 0.18 log(P) + 1.21 log(I) + 0.84 log(Ph)
where Q is the quantity of grilled cheese sandwiches
P is the price of grilled cheese sandwiches
I is income
Ph is the price of hamburgers
-See Scenario 4.5. As the price of grilled cheese sandwiches decreases, the price elasticity of demand:
(Multiple Choice)
4.8/5 (33)
You have just found the consumer's optimal combination of goods using constrained optimization. The marginal utility of income is the:
(Multiple Choice)
5.0/5 (33)
Suppose the aggregate demand for housing in the U.S. includes a substantial speculative component. What happens of the expectations of speculators change, and they believe housing prices will not increase in the future?
(Multiple Choice)
4.9/5 (31)
When a good has a unitary price elasticity, consumer expenditures for the good
(Multiple Choice)
4.8/5 (28)
The substitution effect of a price change for product X is the change in consumption of X associated with a change in
(Multiple Choice)
4.9/5 (33)
Assume that beer is a normal good. If the price of beer rises, then the substitution effect results in the person buying ________ of the good and the income effect results in the person buying ________ of the good.
(Multiple Choice)
4.9/5 (32)
To determine whether an increase in the price of gasoline results in a consumer spending a larger share of their expenditure on gasoline we need to know
(Multiple Choice)
4.9/5 (30)
Which of the following goods may have demand that is potentially affected by the bandwagon effect?
(Multiple Choice)
4.9/5 (32)
Figure 4.1
A consumer's original utility maximizing market basket of goods is shown in Figure 4.1 as point A. Following a price change, the consumer's utility maximizing market basket changes is at point B.
-Refer to Figure 4.1. The income effect of the price change in food on the quantity of food purchased is:
(Multiple Choice)
4.8/5 (31)
Filters
- Essay(0)
- Multiple Choice(0)
- Short Answer(0)
- True False(0)
- Matching(0)