Exam 9: The Analysis of Competitive Markets
Exam 1: Preliminaries77 Questions
Exam 2: The Basics of Supply and Demand135 Questions
Exam 3: Consumer Behavior146 Questions
Exam 4: Individual and Market Demand173 Questions
Exam 5: Uncertainty and Consumer Behavior177 Questions
Exam 6: Production123 Questions
Exam 7: The Cost of Production166 Questions
Exam 8: Profit Maximization and Competitive Supply149 Questions
Exam 9: The Analysis of Competitive Markets177 Questions
Exam 10: Market Power: Monopoly and Monopsony158 Questions
Exam 11: Pricing With Market Power122 Questions
Exam 12: Monopolistic Competition and Oligopoly113 Questions
Exam 13: Game Theory and Competitive Strategy150 Questions
Exam 14: Markets for Factor Inputs123 Questions
Exam 15: Investment, Time, and Capital Markets153 Questions
Exam 16: General Equilibrium and Economic Efficiency111 Questions
Exam 17: Markets With Asymmetric Information130 Questions
Exam 18: Externalities and Public Goods123 Questions
Select questions type
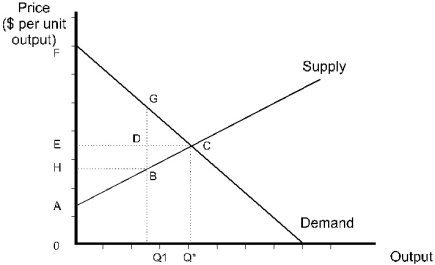 Figure 9.2
-Refer to Figure 9.2. At price 0E and quantity Q*, consumer surplus is the area
Figure 9.2
-Refer to Figure 9.2. At price 0E and quantity Q*, consumer surplus is the area
Free
(Multiple Choice)
4.9/5  (31)
(31)
Correct Answer: Verified
C
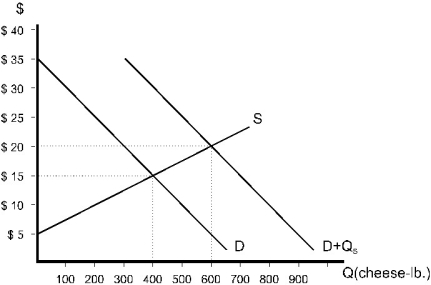 Figure 9.6
-Refer to Figure 9.6. As a result of this policy, quantity will
Figure 9.6
-Refer to Figure 9.6. As a result of this policy, quantity will
Free
(Multiple Choice)
5.0/5 (38)
Correct Answer:Verified
E
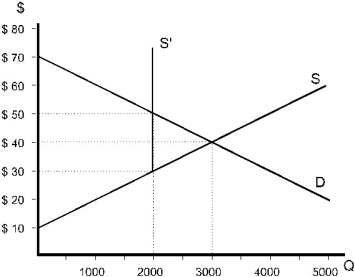 Figure 9.7
-Refer to Figure 9.7. After the policy was implemented, the quantity traded became
Figure 9.7
-Refer to Figure 9.7. After the policy was implemented, the quantity traded became
Free
(Multiple Choice)
4.7/5 (35)
Correct Answer:Verified
B
The utilities commission in a city is currently examining pay telephone service in the city. The commission has been asked to evaluate a proposal by a city council member to place a $0.10 price ceiling on local pay phone service. The staff economist at the utilities commission estimates the demand and supply curves for pay telephone service as follows:
QD = 1600 - 2400P
QS = 200 + 3200P,
where P = price of a pay telephone call, and Q = number of pay telephone calls per month.
a. Determine the equilibrium price and quantity that will prevail without the price ceiling.
b. Analyze the quantity that will be available with the price ceiling (in the long-run).
c. The city council realizes that the telephone company could curtail pay phone service in response to the ceiling. To prevent this, the council plans to impose a requirement that the telephone company must maintain the current number of pay phones. In light of this additional restriction, what will be the likely impact of the price ceiling?
(Essay)
4.9/5 (39)
The world price for oil is $31 per unit. The supply of domestic oil is: QS = 0.15P - 2.7. Domestic producers can sell as many units as they like at world prices. Calculate current domestic producer surplus. Now, suppose in an effort to boost domestic oil production the government pays producers $2 per unit produced. Calculate the new level of producer surplus. Also, calculate the amount the government spends in payments to domestic producers. Does the change in producer surplus exceed the amount of payments made by the government? If government directly paid domestic oil producers the amount they will spend in the subsidy scenario, would domestic oil producers be better off?
(Essay)
4.9/5 (38)
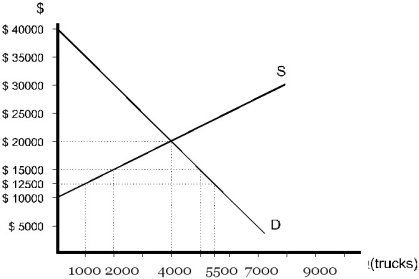 Figure 9.9
-Refer to Figure 9.9. Now suppose an import quota of 3000 trucks is imposed. If the government wanted to cut off all international trade without changing the quota, it could allow the quota amount of 3000 trucks in at no tariff and then charge a tariff on all imports above the quota amount. What tariff would accomplish the goal?
Figure 9.9
-Refer to Figure 9.9. Now suppose an import quota of 3000 trucks is imposed. If the government wanted to cut off all international trade without changing the quota, it could allow the quota amount of 3000 trucks in at no tariff and then charge a tariff on all imports above the quota amount. What tariff would accomplish the goal?
(Multiple Choice)
4.9/5 (30)
The total and marginal cost functions for a typical soft coal producer are:
TC = 75,000 + 0.1Q2 and MC = 0.2Q
where Q is measured in railroad cars per year. The industry consists of 55 identical producers. The market demand curve is:
QD = 140,000 - 425P,
where P is the price per carload. The market can be regarded as competitive.
a. Calculate the short run equilibrium price and quantity in the market. Calculate the quantity that each firm would produce. Calculate producer surplus, consumer surplus, and total surplus at the equilibrium values. Calculate the firm's profit (or loss).
b. The Federal government is considering the imposition of a $15 per carload tax on soft coal. Calculate the short-run equilibrium price and quantity that would exist under the tax. What portion of the tax would be paid by producers and what portion by consumers? Calculate the producer and consumer surplus under the tax and analyze the efficiency consequences of the tax. Calculate the firm's profit (or loss) under the tax. Could the tax be justified despite its efficiency implications?
(Essay)
4.9/5 (27)
Which of the following policies could lead to a deadweight loss?
(Multiple Choice)
4.8/5 (28)
A situation in which the unregulated competitive market outcome is inefficient because prices fail to provide proper signals to buyers and sellers is known as:
(Multiple Choice)
4.7/5 (35)
What is the difference between a price support and a price floor?
(Multiple Choice)
4.8/5 (36)
The market demand and supply functions for alcohol at Major League Baseball games are:
QD = 10 - 0.04P and QS = 3.8P - 2. Calculate the equilibrium quantity and price and point elasticity of supply in equilibrium. Next, calculate producer surplus. Suppose that alcohol is taxed at $0.75 per unit at the games. Calculate the revenues generated by the tax. Calculate the loss in producer surplus. What percentage of the burden of the tax falls on producers?
(Essay)
4.8/5 (33)
The U.S. government currently imposes a $0.54 per gallon tariff on all ethanol imported into the country. If this tariff were removed, then:
(Multiple Choice)
4.8/5 (39)
The market demand and supply functions for milk are: QD = 58 - 30.4P and QS = 16 + 3.2P. If a price floor of $1.75 is implemented, calculate the change in producer surplus. How many surplus units of milk are being produced? If the government purchases all the excess units at $1.75, calculate the milk expenditures by government? Does the increase in producer surplus due to the price floor exceed government spending on excess milk?
(Essay)
4.8/5 (34)
A government can impose an import quota or an equivalent tariff that achieves the same impact on trade. What is the key difference in the welfare outcomes of these two policy options?
(Multiple Choice)
4.9/5 (39)
Figure 9.2
-Refer to Figure 9.2. At price 0E and quantity Q*, producer surplus is the area
(Multiple Choice)
4.7/5 (35)
The market demand and supply functions for VCR movie rentals are: QD = 10 - 0.04P and
QS = 3.8P + 4. Calculate the equilibrium quantity and price and point elasticity of demand in equilibrium. Next, calculate producer surplus. Suppose that VCR movie rentals are taxed at $0.25 per unit. Calculate the revenues generated by the tax. Calculate the loss in producer surplus. What percentage of the burden of the tax falls on producers?
(Essay)
4.9/5 (37)
The elected officials in a west coast university town are concerned about the "exploitative" rents being charged to college students. The town council is contemplating the imposition of a $350 per month rent ceiling on apartments in the city. An economist at the university estimates the demand and supply curves as:
QD = 5600 - 8P QS = 500 + 4P,
where P = monthly rent, and Q = number of apartments available for rent. For purposes of this analysis, apartments can be treated as identical.
a. Calculate the equilibrium price and quantity that would prevail without the price ceiling. Calculate producer and consumer surplus at this equilibrium (sketch a diagram showing both).
b. What quantity will eventually be available if the rent ceiling is imposed? Calculate any gains or losses in consumer and/or producer surplus.
c. Does the proposed rent ceiling result in net welfare gains? Would you advise the town council to implement the policy?
(Essay)
4.9/5 (27)
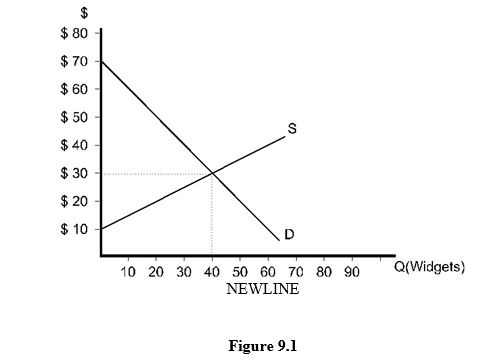 Figure 9.1
-Refer to Figure 9.1. If the market is in equilibrium, total consumer and producer surplus is
Figure 9.1
-Refer to Figure 9.1. If the market is in equilibrium, total consumer and producer surplus is
(Multiple Choice)
4.8/5 (34)
Use the following statements to answer this question:
I. When the market price is held above the competitive price level, it is possible for the loss in consumer surplus to be fully captured by producers.
II. When the market price is held above the competitive level, there is no deadweight loss because producer gains exactly equal consumer losses.
(Multiple Choice)
4.8/5 (32)
Figure 9.2
-Refer to Figure 9.2. At price 0H and quantity Q1, producer surplus is the area
(Multiple Choice)
4.9/5 (37)
Filters
- Essay(0)
- Multiple Choice(0)
- Short Answer(0)
- True False(0)
- Matching(0)