Exam 5: Elasticity of Demand and Supply
Exam 1: The Art and Science of Economic Analysis162 Questions
Exam 1: Appendix--Understanding Graphs71 Questions
Exam 2: Economic Tools and Economics Systems211 Questions
Exam 3: Economic Decision Makers207 Questions
Exam 4: Demand, Supply, and Markets245 Questions
Exam 5: Elasticity of Demand and Supply244 Questions
Exam 5: Appendix--Price Elasticity and Tax Incidence32 Questions
Exam 6: Consumer Choice and Demand171 Questions
Exam 6: Appendix--Indifference Curves and Utility Maximization107 Questions
Exam 7: Production and Cost in the Firm218 Questions
Exam 8: A--Perfect Competition250 Questions
Exam 8: B--Perfect Competition25 Questions
Exam 9: A--Monopoly249 Questions
Exam 9: B--Monopoly18 Questions
Exam 10: Monopolistic Competition and Oligopoly233 Questions
Exam 11: Resource Markets219 Questions
Exam 12: Labor Markets and Labor Unions218 Questions
Exam 13: Capital, Interest, and Corporate Finance190 Questions
Exam 14: Transaction Costs, Imperfect Information, and Behavioral Economics187 Questions
Exam 15: Economic Regulation and Antitrust Policy179 Questions
Exam 16: Public Goods and Public Choice143 Questions
Exam 17: Externalities and the Environment203 Questions
Exam 18: Income Distribution and Poverty130 Questions
Exam 19: International Trade172 Questions
Exam 20: International Finance226 Questions
Exam 21: Economic Development97 Questions
Select questions type
Suppose consumers spent $42 million on Christmas trees last year when the average tree cost $30 and this year spent $42 million when the average tree costs $25.Assuming nothing else changed, this data suggests that
(Multiple Choice)
4.8/5  (29)
(29)
As consumers have a longer time period to respond, the demand for a product typically becomes more inelastic.
(True/False)
4.8/5 (33)
If city officials expect that an increase in bus fares will raise mass transit revenues, they must think that the demand for bus travel is
(Multiple Choice)
4.8/5 (41)
A 10 percent increase in the price of root beer causes a 5 percent increase in the quantity demanded of orange soda.This means that
(Multiple Choice)
4.8/5 (39)
If income rises and the demand for toothbrushes stays the same, income elasticity of toothbrushes is said to be unit elastic.
(True/False)
5.0/5 (33)
Which of the following describes a situation in which demand must be inelastic?
(Multiple Choice)
4.8/5 (35)
If its value of cross-price elasticity is negative, a good must be a necessity.
(True/False)
4.9/5 (26)
Exhibit 5-27  Consider Exhibit 5-27.Which graph depicts a perfectly inelastic demand?
(Multiple Choice)
4.8/5 (31)
Exhibit 5-28 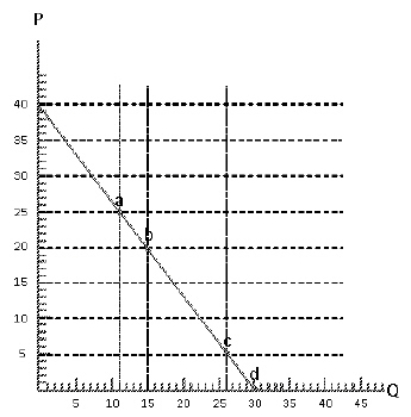 Use the information in Exhibit 5-28 to calculate the value of price elasticity of demand from point c to d.
(Multiple Choice)
4.9/5 (22)
Exhibit 5-6 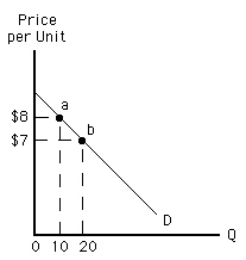 We can tell that demand is elastic as price falls between point a and point b in Exhibit 5-6 because
(Multiple Choice)
5.0/5 (36)
Exhibit 5-27 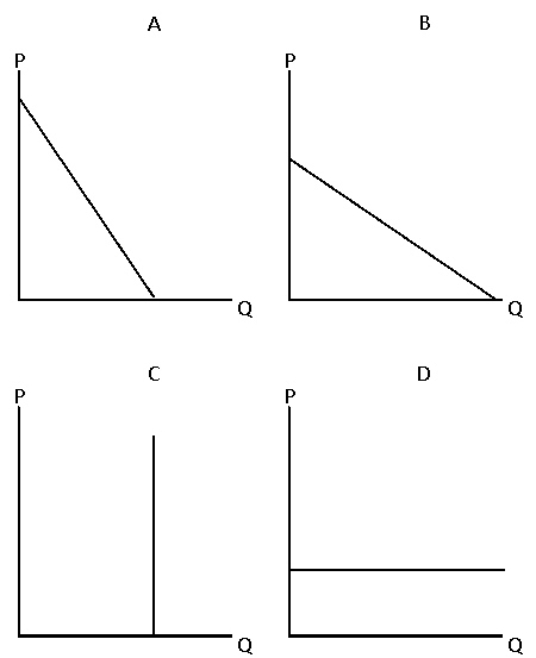 Consider Exhibit 5-27.Which graph depicts a perfectly elastic demand?
(Multiple Choice)
4.8/5 (33)
If an increase in the price of a product from $1 to $2 per unit leads to a decrease in the quantity demanded from 100 to 80 units, then the value of price elasticity of demand is
(Multiple Choice)
4.8/5 (37)
Along a linear demand curve, as the price increases from zero,
(Multiple Choice)
4.8/5 (31)
Filters
- Essay(0)
- Multiple Choice(0)
- Short Answer(0)
- True False(0)
- Matching(0)