Exam 2: Economic Models: Trade-Offs and Trade
Exam 1: First Principles199 Questions
Exam 2: Economic Models: Trade-Offs and Trade299 Questions
Exam 4: Consumer and Producer Surplus229 Questions
Exam 3: Supply and Demand265 Questions
Exam 5: Price Controls and Quotas: Meddling With Markets216 Questions
Exam 6: Elasticity226 Questions
Exam 7: Taxes286 Questions
Exam 8: International Trade260 Questions
Exam 9: Decision Making by Individuals and Firms186 Questions
Exam 10: The Rational Consumer182 Questions
Exam 11: Behind the Supply Curve: Inputs and Costs317 Questions
Exam 12: Perfect Competition and the Supply Curve341 Questions
Exam 13: Monopoly317 Questions
Exam 14: Oligopoly271 Questions
Exam 15: Monopolistic Competition and Product Differentiation245 Questions
Exam 16: Externalities193 Questions
Exam 17: Public Goods and Common Resources208 Questions
Exam 18: The Economics of the Welfare State126 Questions
Exam 19: Factor Markets and the Distribution of Income316 Questions
Exam 20: Uncertainty, Risk, and Private Information192 Questions
Exam 21: Graphs in Economics60 Questions
Exam 22: Consumer Preferences and Consumer Choice135 Questions
Select questions type
Use the following to answer question:
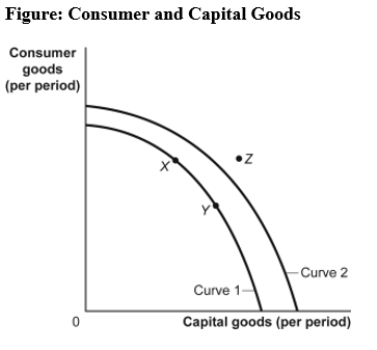 -(Figure: Consumer and Capital Goods)Use Figure: Consumer and Capital Goods.Assume the economy's current production possibilities frontier is given by curve 1.Point Z:
Free
(Multiple Choice)
4.7/5  (41)
(41)
Correct Answer: Verified
A
Fertilizer,used to grow pumpkins,is a factor of production.
Free
(True/False)
4.8/5 (32)
Correct Answer:Verified
False
Because Casey can type reports faster and more accurately than Ahmet,Casey has a(n)_____ in typing reports.
Free
(Multiple Choice)
4.8/5 (30)
Correct Answer:Verified
B
In the simplest circular-flow model,households supply _____ and demand _____.
(Multiple Choice)
4.8/5 (32)
Use the following to answer question:
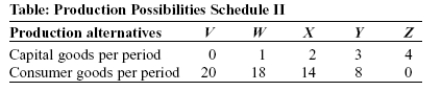 -(Table: Production Possibilities Schedule II)Use Table: Production Possibilities Schedule II.The production of 8 units of consumer goods and 2 units of capital goods per period would result in:
(Multiple Choice)
5.0/5 (30)
Use the following to answer question: 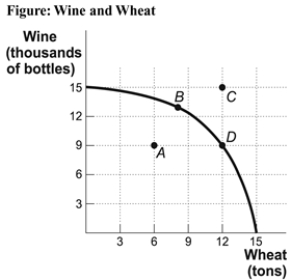 -(Figure: Wine and Wheat)Use Figure: Wine and Wheat.The opportunity cost of moving from producing ONLY wheat to producing at point D is _____ tons of wheat.
(Multiple Choice)
4.9/5 (45)
The circular-flow diagram illustrates how households _____ goods and services and _____ factors of production.
(Multiple Choice)
5.0/5 (33)
Use the following to answer question: 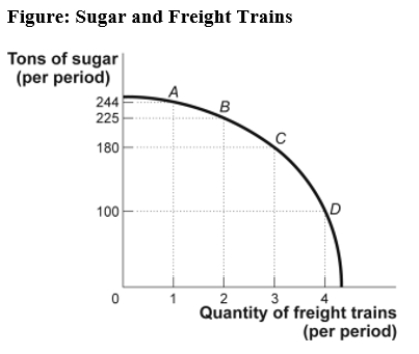 -(Figure: Sugar and Freight Trains)Use Figure: Sugar and Freight Trains.Suppose the economy is operating at point C.The opportunity cost of producing the fourth freight train would be:
(Multiple Choice)
4.8/5 (40)
Use the following to answer question: 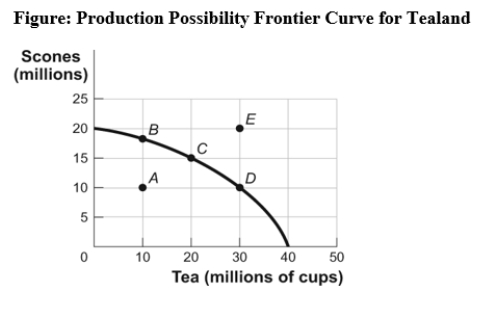 -(Figure: Production Possibility Frontier for Tealand)Use Figure: Production Possibility Frontier for Tealand.Tealand is producing at point C on its production possibility frontier.What is the opportunity cost of increasing the production of tea from 20 million cups to 30 million cups?
(Multiple Choice)
4.8/5 (33)
Use the following to answer question: 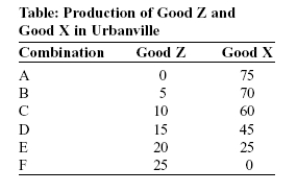 -(Table: Production of Good Z and Good X in Urbanville)Use Table: Production of Good Z and Good X in Urbanville.This table shows the production possibility frontier for Urbanville.Suppose Urbanville is producing at combination C and moves to combination D.What is the opportunity cost of this move?
(Multiple Choice)
4.9/5 (35)
Use the following to answer question: 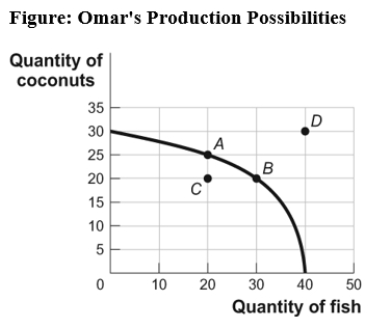 -(Figure: Omar's Production Possibilities)Use Figure: Omar's Production Possibilities.The opportunity cost for Tom to move from point B on the curve to point A is:
(Multiple Choice)
4.8/5 (32)
Use the following to answer question:
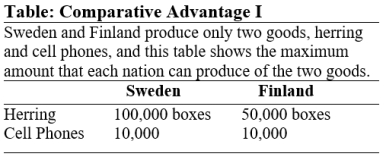 -(Table: Comparative Advantage I)Use Table: Comparative Advantage I.Sweden has a comparative advantage in producing:
(Multiple Choice)
4.9/5 (32)
If the opportunity cost of manufacturing automobiles is higher in the United States than in Britain and the opportunity cost of manufacturing airplanes is lower in the United States than in Britain,then the United States will:
(Multiple Choice)
4.9/5 (41)
The basis of the circular-flow diagram is that the money flowing into each sector or market is greater than the money that flows out.
(True/False)
4.9/5 (39)
Businesses buy resources used to produce goods and services in the:
(Multiple Choice)
4.9/5 (38)
Use the following to answer question:
-(Table: Comparative Advantage I)Use Table: Comparative Advantage I.The opportunity cost of producing 1 box of herring for Finland is _____ box(es)of cell phones.
(Multiple Choice)
4.7/5 (38)
Use the following to answer question:
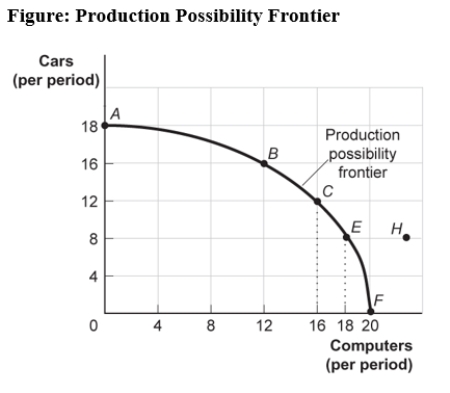 -(Figure: Production Possibility Frontier)Use Figure: Production Possibilities Frontier.Points A,B,E,and F:
(Multiple Choice)
4.8/5 (27)
Filters
- Essay(0)
- Multiple Choice(0)
- Short Answer(0)
- True False(0)
- Matching(0)