Exam 18: Economic Inequality
Exam 1: What Is Economics205 Questions
Exam 2: The Economic Problem145 Questions
Exam 3: Demand and Supply188 Questions
Exam 4: Elasticity166 Questions
Exam 5: Efficiency and Equity123 Questions
Exam 6: Government Actions in Markets125 Questions
Exam 7: Global Markets in Action135 Questions
Exam 8: Utility and Demand116 Questions
Exam 9: Possibilities, preferences, and Choices120 Questions
Exam 10: Output and Costs145 Questions
Exam 11: Perfect Competition114 Questions
Exam 12: Monopoly114 Questions
Exam 13: Monopolistic Competition136 Questions
Exam 14: Oligopoly100 Questions
Exam 15: Externalities114 Questions
Exam 16: Public Goods and Common Resources96 Questions
Exam 17: Markets for Factors of Production122 Questions
Exam 18: Economic Inequality115 Questions
Select questions type
The main reason that wealth inequality persists across generations is that
Free
(Multiple Choice)
5.0/5  (42)
(42)
Correct Answer: Verified
A
Use the figure below to answer the following questions. 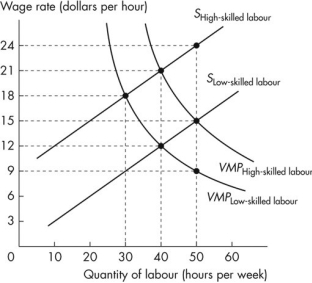 Figure 18.3.5
-Refer to Figure 18.3.5.This figure shows the labour supply curves and the value of marginal product curves for high-skilled and low-skilled workers.If the labour markets are competitive,then for a 40-hour work week,high-skilled workers must be paid
Figure 18.3.5
-Refer to Figure 18.3.5.This figure shows the labour supply curves and the value of marginal product curves for high-skilled and low-skilled workers.If the labour markets are competitive,then for a 40-hour work week,high-skilled workers must be paid
Free
(Multiple Choice)
4.8/5 (29)
Correct Answer:Verified
C
Redistribution of income from the rich to the poor will lead to a reduction in total output.This is known as the
(Multiple Choice)
4.9/5 (36)
Last year you earned $45,000 and paid $9,000 in income taxes.This year you earned $60,000 and paid $15,000 in income taxes.What type of income tax do you face?
(Multiple Choice)
4.8/5 (33)
The closer the income Lorenz curve is to the line of equality,
(Multiple Choice)
4.8/5 (45)
The larger the gap between the income Lorenz curve and the line of equality,
(Multiple Choice)
4.9/5 (33)
Other things remaining the same,if education costs rise substantially,we would expect to see
(Multiple Choice)
4.9/5 (37)
Measured wealth distributions that do not consider the distribution of human capital
(Multiple Choice)
4.8/5 (42)
Use the figure below to answer the following questions. 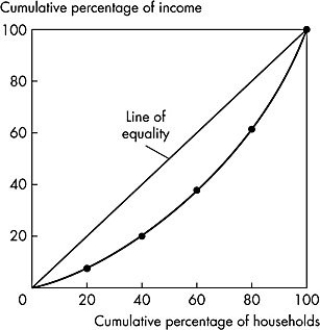 Figure 18.1.1
-In Figure 18.1.1,the second richest 20 percent of all families receive what share of income?
Figure 18.1.1
-In Figure 18.1.1,the second richest 20 percent of all families receive what share of income?
(Multiple Choice)
4.9/5 (41)
Use the figure below to answer the following questions. 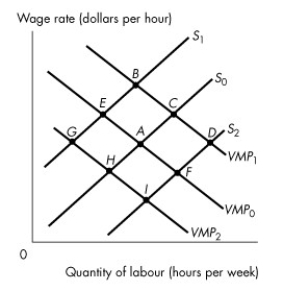 Figure 18.3.6
-Refer to Figure 18.3.6.This is the market for a group of workers.If point A represents the equilibrium for workers with higher human capital,which point represents the equilibrium for the workers with less human capital?
Figure 18.3.6
-Refer to Figure 18.3.6.This is the market for a group of workers.If point A represents the equilibrium for workers with higher human capital,which point represents the equilibrium for the workers with less human capital?
(Multiple Choice)
4.9/5 (33)
The redistribution of income creates the big tradeoff between
(Multiple Choice)
4.8/5 (34)
From an examination of data on income and wealth,it can be concluded that
(Multiple Choice)
4.9/5 (37)
Use the figure below to answer the following questions. Figure 18.1.1
-Refer to Figure 18.1.1.The richest 20 percent of households receive what share of total income?
(Multiple Choice)
4.8/5 (33)
Use the figure below to answer the following questions. Figure 18.3.5
-Refer to Figure 18.3.5.This figure shows the labour supply curves and the value of marginal product curves for high-skilled and low-skilled workers.If there is an increase in the supply of high-skilled workers and the supply of high-skilled workers is now equal to the supply of low-skilled workers,then employment of high-skilled labour would
(Multiple Choice)
4.8/5 (33)
Filters
- Essay(0)
- Multiple Choice(0)
- Short Answer(0)
- True False(0)
- Matching(0)