Exam 16: Public Goods and Common Resources
Exam 1: What Is Economics205 Questions
Exam 2: The Economic Problem145 Questions
Exam 3: Demand and Supply188 Questions
Exam 4: Elasticity166 Questions
Exam 5: Efficiency and Equity123 Questions
Exam 6: Government Actions in Markets125 Questions
Exam 7: Global Markets in Action135 Questions
Exam 8: Utility and Demand116 Questions
Exam 9: Possibilities, preferences, and Choices120 Questions
Exam 10: Output and Costs145 Questions
Exam 11: Perfect Competition114 Questions
Exam 12: Monopoly114 Questions
Exam 13: Monopolistic Competition136 Questions
Exam 14: Oligopoly100 Questions
Exam 15: Externalities114 Questions
Exam 16: Public Goods and Common Resources96 Questions
Exam 17: Markets for Factors of Production122 Questions
Exam 18: Economic Inequality115 Questions
Select questions type
Use the figure below to answer the following question. 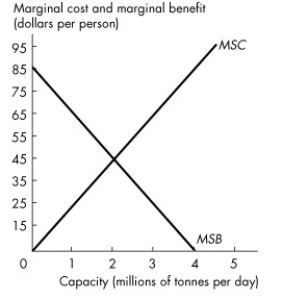 Figure 16.2.2
-Refer to Figure 16.2.2.The graph shows the marginal social benefit and marginal social cost of a garbage disposal system in a city of 1 million people.If voters are well informed about the costs and benefits of the garbage disposal system,the political equilibrium of garbage is
Figure 16.2.2
-Refer to Figure 16.2.2.The graph shows the marginal social benefit and marginal social cost of a garbage disposal system in a city of 1 million people.If voters are well informed about the costs and benefits of the garbage disposal system,the political equilibrium of garbage is
(Multiple Choice)
4.9/5  (35)
(35)
Use the figure below to answer the following questions. 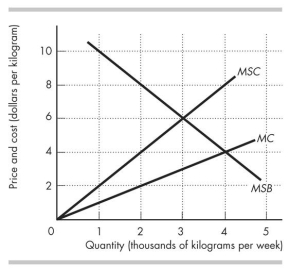 Figure 16.3.1
-Figure 16.3.1 shows the marginal private cost curve,marginal social cost curve,and marginal social benefit curve for cod,a common resource.The equilibrium quantity in an unregulated market is
Figure 16.3.1
-Figure 16.3.1 shows the marginal private cost curve,marginal social cost curve,and marginal social benefit curve for cod,a common resource.The equilibrium quantity in an unregulated market is
(Multiple Choice)
4.8/5 (35)
Use the figure below to answer the following questions. Figure 16.3.1
-Figure 16.3.1 shows the marginal private cost cure,marginal social cost curve,and marginal social benefit curve for cod,a common resource.To achieve an efficient quantity,the price of an ITQ is set at
(Multiple Choice)
4.8/5 (39)
An individual transferable quota is a production limit that
(Multiple Choice)
4.8/5 (32)
The construction of the economy's marginal social benefit curve for a public good reflects the fact that
(Multiple Choice)
4.9/5 (36)
The efficient scale of provision of a public good occurs where
(Multiple Choice)
4.7/5 (46)
Use the table below to answer the following questions.
Table 16.2.1 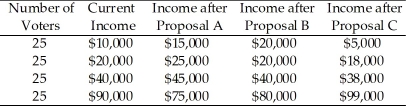 -In Table 16.2.1,which one of the proposals will have the least support?
(Multiple Choice)
5.0/5 (37)
Use the figure below to answer the following questions. 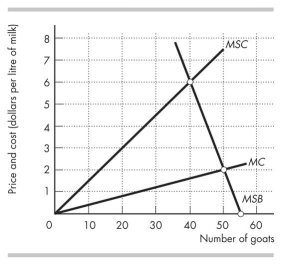 Figure 16.3.2
-Figure 16.3.2 shows the marginal private cost curve,marginal social cost curve,and marginal social benefit curve for raising goats on a common pasture.The equilibrium in an unregulated market is
Figure 16.3.2
-Figure 16.3.2 shows the marginal private cost curve,marginal social cost curve,and marginal social benefit curve for raising goats on a common pasture.The equilibrium in an unregulated market is
(Multiple Choice)
4.9/5 (41)
Filters
- Essay(0)
- Multiple Choice(0)
- Short Answer(0)
- True False(0)
- Matching(0)