Exam 17: Externalities and the Environment
Exam 1: What Is Economics479 Questions
Exam 2: The Economic Problem439 Questions
Exam 3: Demand and Supply515 Questions
Exam 4: Elasticity533 Questions
Exam 5: Efficiency and Equity449 Questions
Exam 6: Government Actions in Markets410 Questions
Exam 7: Global Markets in Action200 Questions
Exam 8: Utility and Demand364 Questions
Exam 9: Possibilities, Preferences, and Choices464 Questions
Exam 10: Organizing Production385 Questions
Exam 11: Output and Costs494 Questions
Exam 12: Perfect Competition487 Questions
Exam 13: Monopoly606 Questions
Exam 14: Monopolistic Competition320 Questions
Exam 15: Oligopoly280 Questions
Exam 16: Public Choices and Public Goods356 Questions
Exam 17: Externalities and the Environment284 Questions
Exam 18: Markets for Factors of Production382 Questions
Exam 19: Economic Inequality354 Questions
Exam 20: Uncertainty and Information233 Questions
Exam 21: Extension A: Review11 Questions
Exam 22: Extension B: Review25 Questions
Exam 23: Extension C: Review14 Questions
Exam 24: Extension D: Review38 Questions
Exam 25: Extension E: Review11 Questions
Exam 26: Extension F: Review18 Questions
Select questions type
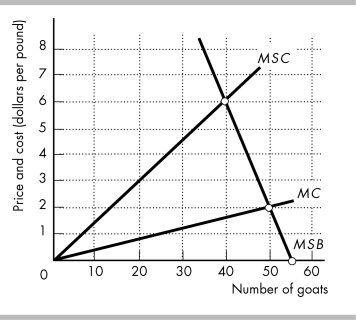 -The above figure shows the marginal private cost curve, marginal social cost curve, and marginal social benefit curve for raising goats on a common pasture. If property rights to the pasture are granted to a farmer so that the farmer owns the pasture, the farmer raises ________.
(Multiple Choice)
4.8/5  (39)
(39)
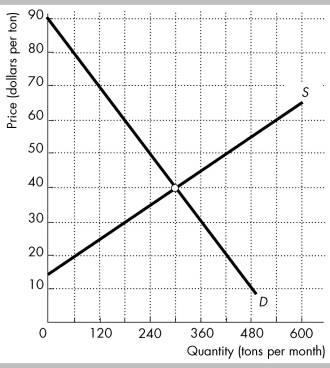 The figure shows the unregulated market for a pesticide, where S is the supply curve and D is the demand curve. The demand curve is the same as the MSB curve. When factories produce the pesticide, they also create waste, which they dump into a lake on the outskirts of the town. The marginal external cost of the dumped waste is equal to the marginal private cost of producing the pesticide.
-In the figure above, if the output is 180 tons per month, what is the marginal social cost of producing the pesticide?
The figure shows the unregulated market for a pesticide, where S is the supply curve and D is the demand curve. The demand curve is the same as the MSB curve. When factories produce the pesticide, they also create waste, which they dump into a lake on the outskirts of the town. The marginal external cost of the dumped waste is equal to the marginal private cost of producing the pesticide.
-In the figure above, if the output is 180 tons per month, what is the marginal social cost of producing the pesticide?
(Multiple Choice)
4.8/5 (40)
A country has several factories that emit sulfur dioxide. The main methods that the government can use to overcome the accompanying environment externalities include all of the following EXCEPT
(Multiple Choice)
4.8/5 (36)
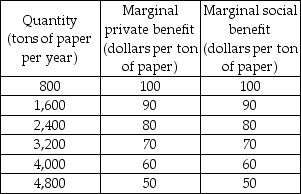
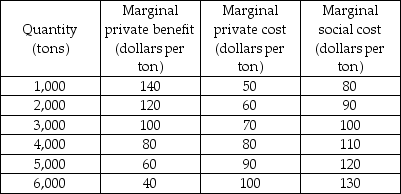
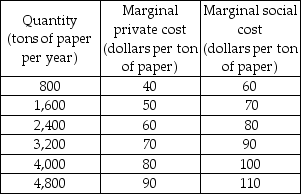 -The tables above show the marginal costs and benefits from production and consumption of paper. From this information we can see that there are
(Multiple Choice)
4.9/5 (38)
The Coase Theorem points out that for an efficient outcome to result, it is irrelevant which party receives the property rights.
(True/False)
4.8/5 (29)
If this pollution occurs, the marginal social cost equals the
(Multiple Choice)
4.8/5 (42)
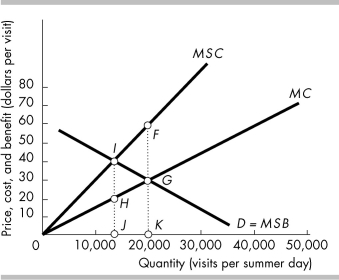 -The figure above illustrates the problem of overcrowding and external costs experienced during the summer months in the state park. If the market is unregulated, in equilibrium the external cost of visiting the state park is given by the distance between
(Multiple Choice)
4.7/5 (36)
Consider a market in which there is an external cost. A tax can be used to arrive at the efficient market equilibrium because the tax will
(Multiple Choice)
4.8/5 (40)
 -The above table shows the marginal benefits and costs from production of fertilizer. There are no external benefits. If the market is perfectly competitive and unregulated, at the equilibrium level of output,
(Multiple Choice)
5.0/5 (36)
The figure shows the unregulated market for a pesticide, where S is the supply curve and D is the demand curve. The demand curve is the same as the MSB curve. When factories produce the pesticide, they also create waste, which they dump into a lake on the outskirts of the town. The marginal external cost of the dumped waste is equal to the marginal private cost of producing the pesticide.
-In the figure above, if no one owns the lake, what is the equilibrium price of the pesticide?
(Multiple Choice)
4.9/5 (40)
Legally established titles to the ownership, use, and disposal of factors of production are referred to as
(Multiple Choice)
5.0/5 (33)
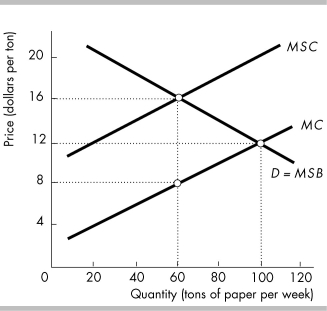 -Using the above figure, the efficient amount of paper produced is
(Multiple Choice)
4.8/5 (32)
One way of overcoming the problem of the commons is to make it private property.
(True/False)
4.8/5 (32)
-The above table shows the marginal benefits and costs from production of fertilizer. There are no external benefits. If the market is perfectly competitive and unregulated, at the equilibrium output, the
(Multiple Choice)
4.9/5 (36)
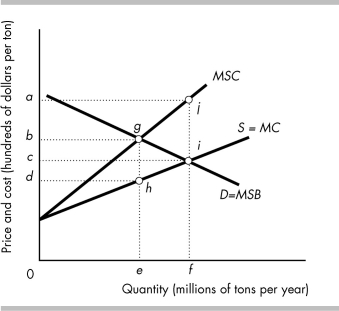 -The figure above shows the market for steel, the production of which creates pollution.
a) What point represents the equilibrium price and what point represents the equilibrium quantity in an unregulated, competitive market?
b) What area represents the deadweight loss of the unregulated, competitive market outcome?
c) What point represents the efficient quantity?
d) If the output level in part (c) was achieved through the use of a government imposed tax, what price would consumers pay? What price would the producers receive? What distance represents the amount of the tax?
e) If government successfully uses marketable permits issued under a cap-and-trade policy to eliminate the external cost, what point represents how much output would be produced?
-The figure above shows the market for steel, the production of which creates pollution.
a) What point represents the equilibrium price and what point represents the equilibrium quantity in an unregulated, competitive market?
b) What area represents the deadweight loss of the unregulated, competitive market outcome?
c) What point represents the efficient quantity?
d) If the output level in part (c) was achieved through the use of a government imposed tax, what price would consumers pay? What price would the producers receive? What distance represents the amount of the tax?
e) If government successfully uses marketable permits issued under a cap-and-trade policy to eliminate the external cost, what point represents how much output would be produced?
(Essay)
4.8/5 (32)
When producing a good creates pollution, an external cost, and the government imposes a tax equal to the marginal external cost, then
(Multiple Choice)
4.7/5 (31)
How does the government determine the quota amount that will produce an efficient use of a common resource?
(Essay)
4.8/5 (32)
The Coase Theorem states that externalities can always be eliminated by the market as long as property rights exist, the number of parties involved is small, and transactions costs are low.
(True/False)
4.8/5 (39)
Filters
- Essay(0)
- Multiple Choice(0)
- Short Answer(0)
- True False(0)
- Matching(0)