Exam 24: Deriving the Growth Accounting Formula
Exam 1: The Central Idea157 Questions
Exam 2: Observing and Explaining the Economy107 Questions
Exam 3: The Supply and Demand Model170 Questions
Exam 4: Subtleties of the Supply and Demand Model: Price Floors, Price Ceilings, and Elasticity182 Questions
Exam 5: Macroeconomics: the Big Picture157 Questions
Exam 6: Measuring the Production, Income, and Spending of Nations180 Questions
Exam 7: The Spending Allocation Model170 Questions
Exam 8: Unemployment and Employment215 Questions
Exam 9: Productivity and Economic Growth165 Questions
Exam 10: Money and Inflation154 Questions
Exam 11: The Nature and Causes of Economic Fluctuations169 Questions
Exam 22: Deriving the Formula for the Keynesian Multiplier and the Forward-Looking Consumption Model28 Questions
Exam 12: The Economic Fluctuations Model206 Questions
Exam 13: Using the Economic Fluctuations Model178 Questions
Exam 14: Fiscal Policy139 Questions
Exam 15: Monetary Policy173 Questions
Exam 16: Capital and Financial Markets174 Questions
Exam 17: Economic Growth and Globalization164 Questions
Exam 18: International Trade250 Questions
Exam 19: International Finance125 Questions
Exam 20: Reading, Understanding, and Creating Graphs35 Questions
Exam 21: the Miracle of Compound Growth11 Questions
Exam 23: Present Discounted Value16 Questions
Exam 24: Deriving the Growth Accounting Formula13 Questions
Select questions type
In the formula  , the term
  represents
Free
(Multiple Choice)
4.8/5  (42)
(42)
Correct Answer: Verified
C
According to the growth-accounting formula, productivity growth
Free
(Multiple Choice)
4.9/5 (34)
Correct Answer:Verified
A
In the formula 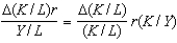 , the term r(K/Y) represents
Free
(Multiple Choice)
5.0/5 (33)
Correct Answer:Verified
B
Between 1975 and 1993, most of the increase in productivity in the United States was due to
(Multiple Choice)
4.7/5 (40)
Use the graph to answer the following questions. 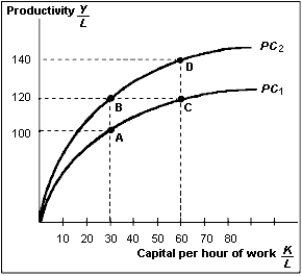 (A)Suppose that between two given years, growth in capital per hour of work and growth in technology were both positive. Pick two points on the graph that represent such a scenario.
(B)Suppose that between two given years, growth in capital per hour of work was zero, and growth in technology was positive. Pick two points on the graph that represent such a scenario.
(C)Suppose that between two given years, growth in capital per hour of work was positive, and growth in technology was negative. Pick two points on the graph that represent such a scenario. What happened to productivity in this particular case?
(A)Suppose that between two given years, growth in capital per hour of work and growth in technology were both positive. Pick two points on the graph that represent such a scenario.
(B)Suppose that between two given years, growth in capital per hour of work was zero, and growth in technology was positive. Pick two points on the graph that represent such a scenario.
(C)Suppose that between two given years, growth in capital per hour of work was positive, and growth in technology was negative. Pick two points on the graph that represent such a scenario. What happened to productivity in this particular case?
(Essay)
4.9/5 (28)
The growth rate of productivity due to an increase in capital income equals
(Multiple Choice)
4.8/5 (34)
Suppose in 2011 that real GDP of a country is $6 trillion, and the capital stock in real terms is $11 trillion. What is the slope of the productivity function?
(Short Answer)
4.9/5 (28)
Suppose the production function Y = f(K,L) is such that  . Plot the production function with Y on the vertical axis and L on the horizontal axis for the case where K = 500. Plot the productivity curve with Y/L on the vertical axis and K/L on the horizontal axis.
(Essay)
5.0/5 (37)
Filters
- Essay(0)
- Multiple Choice(0)
- Short Answer(0)
- True False(0)
- Matching(0)