Exam 20: Reading, Understanding, and Creating Graphs
Exam 1: The Central Idea157 Questions
Exam 2: Observing and Explaining the Economy107 Questions
Exam 3: The Supply and Demand Model170 Questions
Exam 4: Subtleties of the Supply and Demand Model: Price Floors, Price Ceilings, and Elasticity182 Questions
Exam 5: Macroeconomics: the Big Picture157 Questions
Exam 6: Measuring the Production, Income, and Spending of Nations180 Questions
Exam 7: The Spending Allocation Model170 Questions
Exam 8: Unemployment and Employment215 Questions
Exam 9: Productivity and Economic Growth165 Questions
Exam 10: Money and Inflation154 Questions
Exam 11: The Nature and Causes of Economic Fluctuations169 Questions
Exam 22: Deriving the Formula for the Keynesian Multiplier and the Forward-Looking Consumption Model28 Questions
Exam 12: The Economic Fluctuations Model206 Questions
Exam 13: Using the Economic Fluctuations Model178 Questions
Exam 14: Fiscal Policy139 Questions
Exam 15: Monetary Policy173 Questions
Exam 16: Capital and Financial Markets174 Questions
Exam 17: Economic Growth and Globalization164 Questions
Exam 18: International Trade250 Questions
Exam 19: International Finance125 Questions
Exam 20: Reading, Understanding, and Creating Graphs35 Questions
Exam 21: the Miracle of Compound Growth11 Questions
Exam 23: Present Discounted Value16 Questions
Exam 24: Deriving the Growth Accounting Formula13 Questions
Select questions type
Refer to the table below, which shows data for the United States. 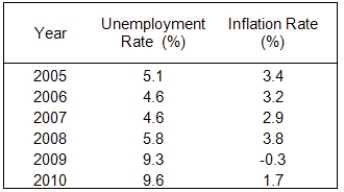 (A)Construct a time-series plot of the unemployment rate.
(B)Construct a time-series plot of the inflation rate.
(C)Construct a scatter plot of the data. Is there any apparent correlation between the inflation rate and the unemployment rate in these data?
(A)Construct a time-series plot of the unemployment rate.
(B)Construct a time-series plot of the inflation rate.
(C)Construct a scatter plot of the data. Is there any apparent correlation between the inflation rate and the unemployment rate in these data?
Free
(Essay)
4.8/5  (37)
(37)
Correct Answer: Verified
(A)A time-series plot of the unemployment rate: 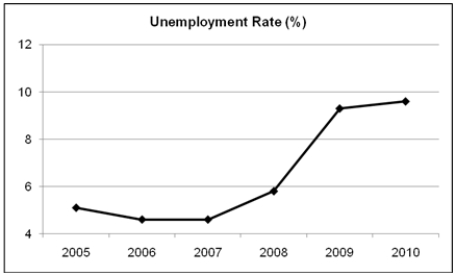 (B)A time-series plot of the inflation rate:
 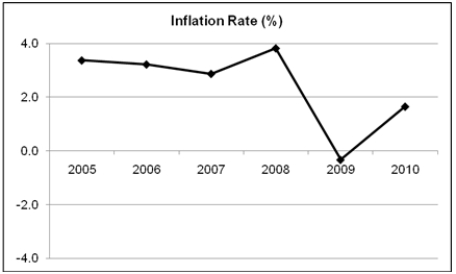 (C)A scatter plot is shown below. There is an apparent negative correlation between the inflation rate and the unemployment rate.
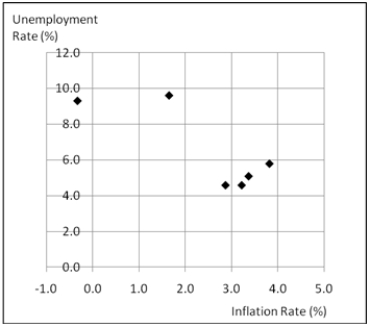
Consider a ratio for the total number of miles traveled by car divided by the total number of drivers.
(A)If both the total number of miles traveled by car and the total number of drivers increase over time, what must be true for the ratio to rise over time?
(B)If both the total number of miles traveled by car and the total number of drivers fall over time, what must be true for the ratio to rise over time?
(C)If the ratio is not changing over time, what must be true about the total number of miles traveled by car and the total number of drivers over time, and relative to each other?
Free
(Essay)
4.7/5 (31)
Correct Answer:Verified
(A)The total number of miles traveled by car must increase faster than the total number of drivers.
(B)The total number of drivers must decrease faster than the decrease in the total number of miles traveled by car.
(C)The total number of miles traveled by car must increase or decrease at the same rate as does the total number of drivers.
A two-dimensional graph cannot be used to show what will happen to the relationship between X and Y if any of the ceteris paribus assumptions change.
Free
(True/False)
4.8/5 (33)
Correct Answer:Verified
False
Graph the relationship between X and Y such that the relationship between X and Y is linear and positive.
(A)On this graph, show what happens to Y if X increases.
(B)Suppose there is a third variable, Z, that causes Y to decrease (for any given value of X) whenever Z increases. Show what happens to the relationship between X and Y.
(Essay)
4.8/5 (38)
Exhibit 2A-3 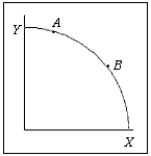 -According to Exhibit 2A-3, which of the following is true?
(Multiple Choice)
4.7/5 (32)
A curve shows that every time family income increases by $1, spending increases by $.75. This curve would
(Multiple Choice)
4.7/5 (36)
Exhibit 2A-4 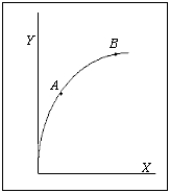 -Refer to Exhibit 2A-4. Which of the following statements is true?
(Multiple Choice)
4.9/5 (29)
Exhibit 2A-7 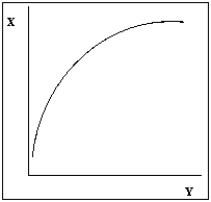 -Exhibit 2A-7 shows the relationship between X and Y. The slope of the relationship is
(Multiple Choice)
4.8/5 (26)
Exhibit 2A-2 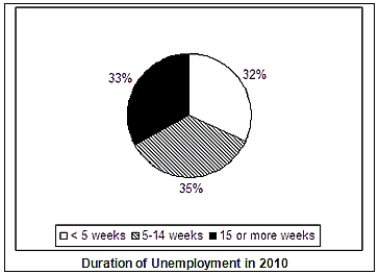 -The type of chart shown in Exhibit 2A-2 is referred to as a
(Multiple Choice)
5.0/5 (37)
Suppose a curve shows that every time family income increases by $1, spending increases by $.75. If family income increases by $500, then spending will increase by
(Multiple Choice)
4.9/5 (32)
Exhibit 2A-8 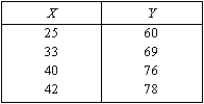 -There is a linear relationship between X and Y in Exhibit 2A-8.
(True/False)
4.9/5 (34)
Exhibit 2A-5 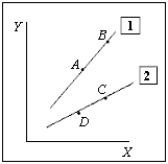 -Refer to Exhibit 2A-5. Which of the following would best explain the shift from line 1 to line 2?
(Multiple Choice)
4.9/5 (39)
The table below shows the inflation rate for the period 2005 through 2010. Suppose you wanted to show that there was not much variation in the inflation rate over this period. How would you represent this table in a graph? Suppose you wanted to show that there was a large amount of variation during this period. How would you represent this table in a graph? 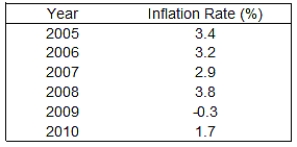
(Essay)
4.8/5 (39)
Exhibit 2A-2
-Suppose in 2010, on average, 10 million people were unemployed. According to Exhibit 2A-2, how many of these people had been unemployed for less than five weeks?
(Multiple Choice)
4.7/5 (34)
Exhibit 2A-5
-Refer to Exhibit 2A-5. The movement from A to B is called a
(Multiple Choice)
4.9/5 (35)
Exhibit 2A-8
-The slope of the relationship between X and Y is positive in Exhibit 2A-8.
(True/False)
4.9/5 (28)
Filters
- Essay(0)
- Multiple Choice(0)
- Short Answer(0)
- True False(0)
- Matching(0)