Exam 3: The Supply and Demand Model
Exam 1: The Central Idea157 Questions
Exam 2: Observing and Explaining the Economy107 Questions
Exam 3: The Supply and Demand Model170 Questions
Exam 4: Subtleties of the Supply and Demand Model: Price Floors, Price Ceilings, and Elasticity182 Questions
Exam 5: Macroeconomics: the Big Picture157 Questions
Exam 6: Measuring the Production, Income, and Spending of Nations180 Questions
Exam 7: The Spending Allocation Model170 Questions
Exam 8: Unemployment and Employment215 Questions
Exam 9: Productivity and Economic Growth165 Questions
Exam 10: Money and Inflation154 Questions
Exam 11: The Nature and Causes of Economic Fluctuations169 Questions
Exam 22: Deriving the Formula for the Keynesian Multiplier and the Forward-Looking Consumption Model28 Questions
Exam 12: The Economic Fluctuations Model206 Questions
Exam 13: Using the Economic Fluctuations Model178 Questions
Exam 14: Fiscal Policy139 Questions
Exam 15: Monetary Policy173 Questions
Exam 16: Capital and Financial Markets174 Questions
Exam 17: Economic Growth and Globalization164 Questions
Exam 18: International Trade250 Questions
Exam 19: International Finance125 Questions
Exam 20: Reading, Understanding, and Creating Graphs35 Questions
Exam 21: the Miracle of Compound Growth11 Questions
Exam 23: Present Discounted Value16 Questions
Exam 24: Deriving the Growth Accounting Formula13 Questions
Select questions type
Draw a supply and demand diagram. Label the equilibrium price and equilibrium quantity as well as the axes and curves.
Free
(Essay)
4.8/5  (37)
(37)
Correct Answer: Verified
Pe = equilibrium price
Qe = equilibrium quantity 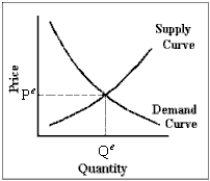
Suppose that the price of bananas has been rising while the amount sold has been falling. Which of the following is the best explanation?
(A)Consumer preferences have shifted in favor of bananas because they are healthful.
(B)Consumer incomes have risen faster than inflation.
(C)Bad weather has reduced some banana crops.
Free
(Essay)
4.8/5 (28)
Correct Answer:Verified
The best explanation is (C) because a reduction in supply would have led to a higher price and a lower quantity sold, as predicted. The other explanations would have led to a higher price and a higher quantity sold.
Which of the following statements is false?
Free
(Multiple Choice)
4.9/5 (38)
Correct Answer:Verified
C
A rightward shift of a supply curve represents an increase in supply.
(True/False)
4.9/5 (35)
Exhibit 3-3 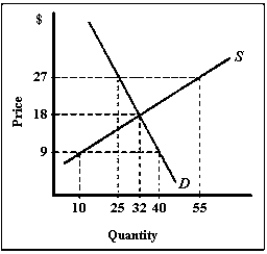 -Refer to Exhibit 3-3. A shortage of ____ units will result in a price of ____.
(Multiple Choice)
4.8/5 (41)
An increase in production costs shifts the supply curve leftward.
(True/False)
5.0/5 (35)
Suppose more firms enter the computer market. What will happen to demand, quantity demanded, supply, and quantity supplied as a result of this market change?
(Essay)
4.9/5 (28)
Which of the following will not increase the demand for a good?
(Multiple Choice)
4.8/5 (27)
In which of the following statements are the terms demand, supply, quantity demanded, and/or quantity supplied used correctly?
(Multiple Choice)
4.9/5 (30)
If the equilibrium quantity decreases while the equilibrium price increases, which of the following is the most likely reason?
(Multiple Choice)
4.7/5 (37)
The demand curve is a relationship between the price of a good and the quantity consumers are willing to buy at that price.
(True/False)
4.9/5 (38)
When economists say that the supply of a product has decreased, they mean that
(Multiple Choice)
5.0/5 (34)
What is the difference between a decrease in demand and a decrease in quantity demanded?
(Essay)
4.9/5 (27)
Exhibit 3-4 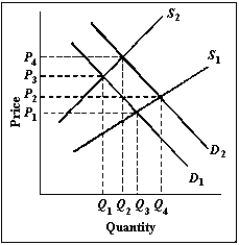 -In Exhibit 3-4, which of the following is the most likely reason for the shift of the demand curve from D1 to D2?
(Multiple Choice)
4.8/5 (36)
With a single supply and demand diagram, illustrate a shortage and a surplus. Carefully label the diagram.
(Essay)
4.7/5 (35)
Filters
- Essay(0)
- Multiple Choice(0)
- Short Answer(0)
- True False(0)
- Matching(0)