Exam 2: Descriptive Statistics and Data Analysis
Exam 1: Data and Business Decisions93 Questions
Exam 2: Descriptive Statistics and Data Analysis99 Questions
Exam 3: Probability Concepts and Distributions111 Questions
Exam 4: Sampling and Estimation123 Questions
Exam 5: Hypothesis Testing and Statistical Inference99 Questions
Exam 6: Regression Analysis93 Questions
Exam 7: Forecasting100 Questions
Exam 8: Introduction to Statistical Quality Control101 Questions
Exam 9: Building and Using Decision Models74 Questions
Exam 10: Decision Models With Uncertainty and Risk90 Questions
Exam 11: Decisions, uncertainty, and Risk100 Questions
Exam 12: Queues and Process Simulation Modeling97 Questions
Exam 13: Linear Optimization98 Questions
Exam 14: Integer, nonlinear, and Advanced Optimization Methods100 Questions
Select questions type
Using Microsoft Excel 2010,the function that computes the most frequently occurring values of a set of data is ________.
(Multiple Choice)
4.8/5  (38)
(38)
All of the following are examples of measures of dispersion except ________.
(Multiple Choice)
4.7/5 (36)
The higher the kurtosis,the more area the histogram has in the middle rather than in the tails.
(True/False)
4.8/5 (48)
A distribution that is relatively peaked with a low degree of dispersion has a coefficient of kurtosis that is ________.
(Multiple Choice)
4.9/5 (31)
In a box plot,the outer boundaries of the box represent the ________.
(Multiple Choice)
4.7/5 (38)
For a negatively skewed distribution,the mode is greater than the median,which is greater than the mean.
(True/False)
4.9/5 (42)
Use the table below to answer the following question(s).The table shows the crude oil prices in dollars per barrel,for 2007. 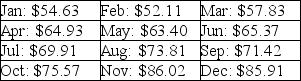 -Calculate the mean price of crude oil in 2007.
(Short Answer)
4.7/5 (30)
The degree of variation in or the numerical spread of the data is known as ________.
(Multiple Choice)
4.7/5 (33)
Outliers defined as being more than 3*IQR away from Q1 and Q3 are considered ________.
(Multiple Choice)
4.9/5 (36)
A distribution that is relatively flat with a wide degree of dispersion has a coefficient of kurtosis that is ________.
(Multiple Choice)
4.7/5 (35)
In Microsoft Excel 2010,the function that computes the standard deviation of a set of data,assumed to be a sample,is ________.
(Multiple Choice)
4.8/5 (30)
Which of the following can be used to represent dispersion in a data set?
(Multiple Choice)
4.8/5 (29)
Filters
- Essay(0)
- Multiple Choice(0)
- Short Answer(0)
- True False(0)
- Matching(0)