Exam 8: Taxes
Exam 1: Getting Started121 Questions
Exam 2: The Australian and Global Economies84 Questions
Exam 3: The Economic Problem70 Questions
Exam 4: Demand and Supply139 Questions
Exam 5: Elasticities of Demand and Supply125 Questions
Exam 6: Efficiency and Fairness of Markets130 Questions
Exam 7: Government Actions in Markets96 Questions
Exam 8: Taxes99 Questions
Exam 9: Global Markets in Action108 Questions
Exam 10: Externalities109 Questions
Exam 11: Public Goods and Common Resources66 Questions
Exam 12: Consumer Choice and Demand78 Questions
Exam 13: Production and Cost106 Questions
Exam 14: Perfect Competition105 Questions
Exam 15: Monopoly143 Questions
Exam 16: Monopolistic Competition82 Questions
Exam 17: Oligopoly71 Questions
Exam 18: Markets for Factors of Production74 Questions
Exam 19: Economic Inequality53 Questions
Select questions type
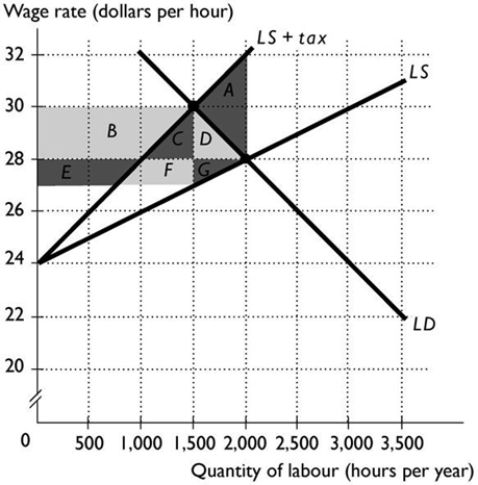 -The above figure shows the labour market for surveyors. The total amount collected as taxes equals
Free
(Multiple Choice)
4.8/5  (37)
(37)
Correct Answer: Verified
E
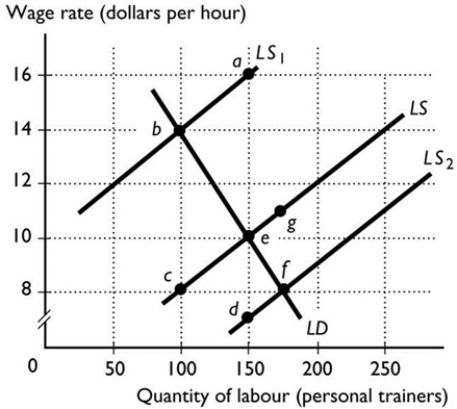 -The figure above shows the labour supply and labour demand curves for personal trainers in Victoria. The initial equilibrium hourly wage is $10. The government of Victoria institutes an additional income tax on the income of personal trainers of $6 an hour in order to fund school sports programs. With the tax in place, the labour supply curve will
Free
(Multiple Choice)
4.8/5 (31)
Correct Answer:Verified
B
The buyers pay all of a tax when the demand is
Free
(Multiple Choice)
4.9/5 (36)
Correct Answer:Verified
B
If the average tax rate increases as income increases, then the
(Multiple Choice)
4.8/5 (41)
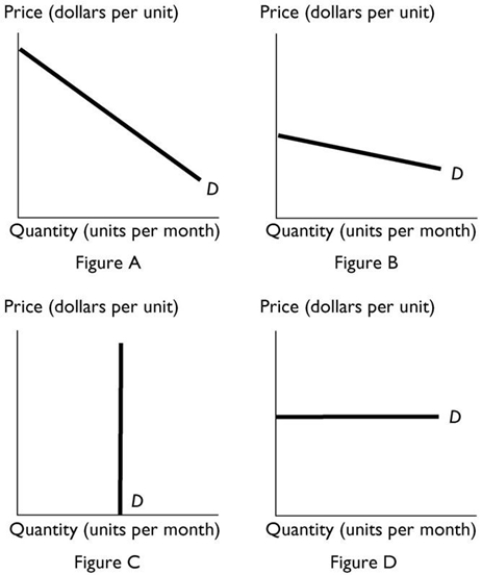 -The above figure shows the demand curves in four different markets. If each of the markets has an identical upward-sloping supply curve and the same tax is levied on suppliers, which market would produce the largest amount of deadweight loss?
(Multiple Choice)
4.9/5 (39)
Suppose the elasticity of demand for takeaway food is 3.00 and the elasticity of supply is 1.20. If the government imposes a sales tax on takeaway food to promote healthy eating, which of the following occurs? i. Less takeaway food is purchased by buyers.
Ii) Less takeaway food is produced by sellers.
Iii) The government receives the excess burden as revenue.
Iv) Both the consumer surplus and the producer surplus decrease.
(Multiple Choice)
4.8/5 (40)
A tax on the income from land or other resource with a perfectly inelastic supply
(Multiple Choice)
4.8/5 (31)
If the average tax rate ________ as income increases, then the tax is a ________ tax.
(Multiple Choice)
5.0/5 (34)
When a tax is imposed on a good, at the after-tax equilibrium the marginal benefit of the last unit produced ________ the marginal cost.
(Multiple Choice)
4.9/5 (25)
To calculate the revenue the government receives when a tax is imposed on a good, multiply the
(Multiple Choice)
4.9/5 (33)
Suppose the elasticity of demand for a product is 0 and elasticity of supply is 1. If the government imposes a tax on the product, then
(Multiple Choice)
4.8/5 (42)
The buyer will pay the entire tax levied on a good when the demand for the good is ________ or when the supply of the good is ________.
(Multiple Choice)
4.9/5 (38)
Which of the following is an example of a tax following the benefits principle? i. Sales taxes on petrol used to fund road maintenance projects.
Ii) Federal income tax used to provide income support for poorer households.
Iii) Property taxes used to finance public education.
(Multiple Choice)
4.8/5 (25)
Consider a payroll tax paid by workers versus a payroll tax paid by employers. In comparing the outcomes of each type of tax, we see that
(Multiple Choice)
4.9/5 (32)
Ann pays $3,850 in taxes on an income of $38,500. Therefore her
(Multiple Choice)
4.9/5 (38)
Which of the following taxes best illustrates the benefits principle of taxation?
(Multiple Choice)
4.8/5 (32)
The supply of sand is perfectly inelastic and the demand curve for sand is downward sloping. Hence, if a tax on sand is imposed,
(Multiple Choice)
4.8/5 (32)
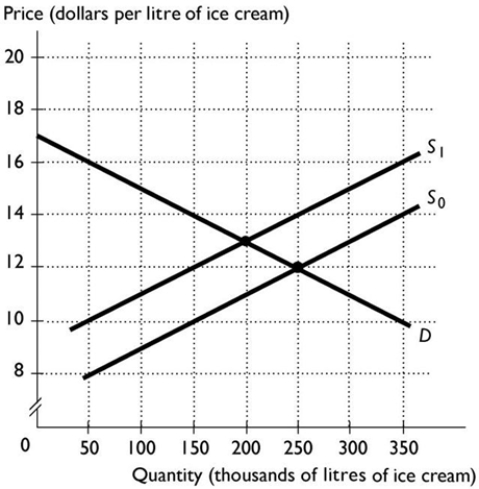 -The above figure shows the market for gourmet ice cream. In an effort to reduce obesity, the government places a $2 tax per litre on suppliers in this market, shifting the supply curve from S0 to S1. The tax incidence is
(Multiple Choice)
4.9/5 (37)
-The above figure shows the market for gourmet ice cream. In an effort to reduce obesity, the government places a $2 tax per litre on suppliers in this market, shifting the supply curve from S0 to S1. The quantity of ice cream consumed before the tax is ________ litres and the quantity consumed after the tax is ________ litres.
(Multiple Choice)
4.9/5 (42)
Filters
- Essay(0)
- Multiple Choice(0)
- Short Answer(0)
- True False(0)
- Matching(0)