Exam 19: Economic Inequality
Exam 1: Getting Started121 Questions
Exam 2: The Australian and Global Economies84 Questions
Exam 3: The Economic Problem70 Questions
Exam 4: Demand and Supply139 Questions
Exam 5: Elasticities of Demand and Supply125 Questions
Exam 6: Efficiency and Fairness of Markets130 Questions
Exam 7: Government Actions in Markets96 Questions
Exam 8: Taxes99 Questions
Exam 9: Global Markets in Action108 Questions
Exam 10: Externalities109 Questions
Exam 11: Public Goods and Common Resources66 Questions
Exam 12: Consumer Choice and Demand78 Questions
Exam 13: Production and Cost106 Questions
Exam 14: Perfect Competition105 Questions
Exam 15: Monopoly143 Questions
Exam 16: Monopolistic Competition82 Questions
Exam 17: Oligopoly71 Questions
Exam 18: Markets for Factors of Production74 Questions
Exam 19: Economic Inequality53 Questions
Select questions type
A regressive income tax is a tax for which the average tax rate
Free
(Multiple Choice)
4.8/5  (39)
(39)
Correct Answer: Verified
E
The cost of acquiring a skill accounts for why the
Free
(Multiple Choice)
4.8/5 (39)
Correct Answer:Verified
A
If the Lorenz curve for income moves upward toward the 45° line, then the
Free
(Multiple Choice)
4.9/5 (35)
Correct Answer:Verified
E
High-skilled workers earn more relative to low-skilled workers because the demand for high-skilled workers is ________ that for low-skilled workers and the supply is ________ that for low-skilled workers.
(Multiple Choice)
4.8/5 (31)
What determines the position of the supply curve of high-skilled workers relative to that of low-skilled workers?
(Multiple Choice)
4.8/5 (25)
A household's income earned from the markets for factors of production and with no government redistribution is
(Multiple Choice)
4.7/5 (38)
The rates of return on high school and university educations have
(Multiple Choice)
4.9/5 (35)
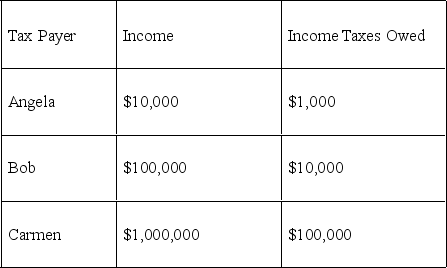 -The table above shows three taxpayers, their incomes, and taxes owed. The data reflect a ________ income tax system because people pay ________.
(Multiple Choice)
4.9/5 (37)
Looking at the results of government income redistribution programs, we expect to find that the income received by the
(Multiple Choice)
4.9/5 (30)
 -Comparing the wealth and income distribution in Australia, we see that
(Multiple Choice)
4.8/5 (44)
Measured annual income inequality overstates actual lifetime inequality because
(Multiple Choice)
4.9/5 (32)
With a negative income tax that has a $10,000 guaranteed income and a 25 per cent tax rate, a household that has a market income of $14,000 has a total income of
(Multiple Choice)
4.8/5 (30)
With a negative income tax that has a $10,000 guaranteed minimum income and a 25 per cent tax rate, a household that has earned income of $16,000 has a total income of
(Multiple Choice)
4.8/5 (33)
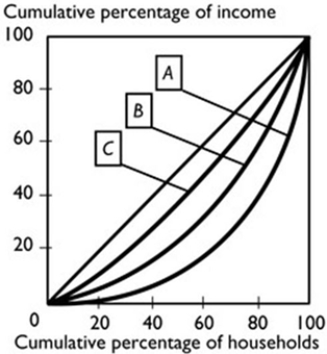
-In the figure above, the nation with the least equal distribution of income is nation
(Multiple Choice)
4.8/5 (39)
Discrimination by customers creates a wage differential between two groups by creating a difference in the two groups'
(Multiple Choice)
4.9/5 (28)
Filters
- Essay(0)
- Multiple Choice(0)
- Short Answer(0)
- True False(0)
- Matching(0)