Exam 19: What Macroeconomics Is All About
Exam 1: Economic Issues and Concepts104 Questions
Exam 2: Economic Theories, data, and Graphs115 Questions
Exam 3: Demand, supply, and Price90 Questions
Exam 4: Elasticity130 Questions
Exam 5: Price Controls and Market Efficiency83 Questions
Exam 6: Consumer Behaviour84 Questions
Exam 7: Producers in the Short Run139 Questions
Exam 8: Producers in the Long Run108 Questions
Exam 9: Competitive Markets145 Questions
Exam 10: Monopoly, cartels, and Price Discrimination88 Questions
Exam 11: Imperfect Competition and Strategic Behaviour111 Questions
Exam 12: Economic Efficiency and Public Policy72 Questions
Exam 13: How Factor Markets Work112 Questions
Exam 14: Labour Markets and Income Inequality67 Questions
Exam 16: Market Failures and Government Intervention115 Questions
Exam 17: The Economics of Environmental Protection126 Questions
Exam 18: Taxation and Public Expenditure111 Questions
Exam 19: What Macroeconomics Is All About114 Questions
Exam 20: The Measurement of National Income104 Questions
Exam 21: The Simplest Short-Run Macro Model63 Questions
Exam 22: Adding Government and Trade to the Simple Macro Model74 Questions
Exam 23: Output and Prices in the Short Run119 Questions
Exam 24: From the Short Run to the Long Run: the Adjustment of Factor Prices125 Questions
Exam 25: Long-Run Economic Growth118 Questions
Exam 26: Money and Banking102 Questions
Exam 27: Money, interest Rates, and Economic Activity95 Questions
Exam 28: Monetary Policy in Canada110 Questions
Exam 29: Inflation and Disinflation98 Questions
Exam 30: Unemployment Fluctuations and the Nairu111 Questions
Exam 31: Government Debt and Deficits91 Questions
Exam 32: The Gains From International Trade50 Questions
Exam 34: Exchange Rates and the Balance of Payments206 Questions
Select questions type
On a graph showing real national income on the vertical axis and time on the horizontal axis,the fluctuations of real national income around the trend -line would indicate the
(Multiple Choice)
4.8/5  (50)
(50)
If nominal national income increased by 10% over a certain period of time while real national income increased by 20%,then
(Multiple Choice)
4.8/5 (32)
The table below provides macroeconomic data for a hypothetical economy.Dollar amounts are all in constant-dollar terms. 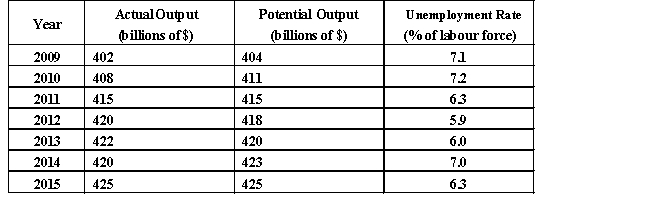 TABLE 19-1
-Refer to Table 19-1. In the year 2012, it is probably the case that workers are ________ and factories are________.
TABLE 19-1
-Refer to Table 19-1. In the year 2012, it is probably the case that workers are ________ and factories are________.
(Multiple Choice)
4.8/5 (33)
Which of the following is the best description of the business cycle?
(Multiple Choice)
5.0/5 (26)
Assume that Sarah agrees to lend $100 to Sam for one year.Sam agrees to pay Sarah $110 at the end of the year.If inflation over that one year is 7%,what real rate of interest does Sarah earn on her $100?
(Multiple Choice)
4.9/5 (43)
The table below provides macroeconomic data for a hypothetical economy.Dollar amounts are all in constant-dollar terms. TABLE 19-1
-Refer to Table 19-1.In which years was this economy experiencing an inflationary gap?
(Multiple Choice)
4.8/5 (45)
Suppose Canadaʹs exchange rate with the U.S.dollar increases from 1.14 to 1.22.Which of the following is likely to happen?
(Multiple Choice)
4.9/5 (36)
Consider an economy in which existing capital is being used at a high degree,shortages in labour and goods markets are developing,and costs are rising.Which of the following terms best describes this stage of the business cycle?
(Multiple Choice)
4.9/5 (42)
Most economists believe that the single largest cause of rising material living standards over long periods of time is
(Multiple Choice)
4.8/5 (35)
The table below provides macroeconomic data for a hypothetical economy.Dollar amounts are all in constant-dollar terms. TABLE 19-1
-Refer to Table 19-1. In the year 2014, it is probably the case that workers are ________ and factories are________.
(Multiple Choice)
4.8/5 (43)
If 0.75 U.S.dollars can be exchanged for one Canadian dollar,we say that the Canadian -U.S.exchange rate is
(Multiple Choice)
4.9/5 (42)
As the banking industry becomes more and more automated,tellers find themselves with unneeded skills and some of them become unemployed.At the same time,software engineers are in increasing demand.These unemployed tellers would be classified as
(Multiple Choice)
4.8/5 (41)
In order to determine the economyʹs real GDP growth rate between two time periods,we should look at
(Multiple Choice)
4.8/5 (32)
Suppose that in 2016 Canadaʹs automobile manufacturers produced 2 million cars priced at $20 000 each.And in 2017 they produced 1 million cars priced at $40 000 each.Ceteris paribus,the change in nominal national income is
(Multiple Choice)
4.9/5 (44)
The table below provides macroeconomic data for a hypothetical economy.Dollar amounts are all in constant-dollar terms. TABLE 19-1
-Refer to Table 19-1.What is the unemployment rate when this economy is at ʺfull employmentʺ?
(Multiple Choice)
4.9/5 (36)
If one Canadian dollar can be exchanged for 0.5 euros,we say that the Canadian -euro exchange rate is
(Multiple Choice)
4.7/5 (41)
A nationʹs real national income in a given year measures the
(Multiple Choice)
4.9/5 (41)
When macroeconomists use the term ʺrecessionʺ they usually define it as a fall in real GDP that lasts for at least
(Multiple Choice)
4.9/5 (41)
Suppose that a price index for a certain basket of goods and services has a value of 150 in 2015 and a value of 156 in 2016.This index suggests that the cost of the market basket of goods and services
(Multiple Choice)
4.8/5 (42)
Filters
- Essay(0)
- Multiple Choice(0)
- Short Answer(0)
- True False(0)
- Matching(0)