Exam 24: From the Short Run to the Long Run: the Adjustment of Factor Prices
Exam 1: Economic Issues and Concepts130 Questions
Exam 2: Economic Theories, Data, and Graphs140 Questions
Exam 3: Demand, Supply, and Price161 Questions
Exam 4: Elasticity160 Questions
Exam 5: Price Controls and Market Efficiency125 Questions
Exam 6: Consumer Behaviour140 Questions
Exam 7: Producers in the Short Run144 Questions
Exam 8: Producers in the Long Run141 Questions
Exam 9: Competitive Markets153 Questions
Exam 10: Monopoly, Cartels, and Price Discrimination126 Questions
Exam 11: Imperfect Competition and Strategic Behaviour126 Questions
Exam 12: Economic Efficiency and Public Policy123 Questions
Exam 13: How Factor Markets Work124 Questions
Exam 14: Labour Markets and Income Inequality117 Questions
Exam 16: Market Failures and Government Intervention123 Questions
Exam 17: The Economics of Environmental Protection133 Questions
Exam 18: Taxation and Public Expenditure121 Questions
Exam 19: What Macroeconomics Is All About116 Questions
Exam 20: The Measurement of National Income117 Questions
Exam 21: The Simplest Short-Run Macro Model156 Questions
Exam 22: Adding Government and Trade to the Simple Macro Model132 Questions
Exam 23: Output and Prices in the Short Run142 Questions
Exam 24: From the Short Run to the Long Run: the Adjustment of Factor Prices148 Questions
Exam 25: Long-Run Economic Growth132 Questions
Exam 26: Money and Banking119 Questions
Exam 27: Money, Interest Rates, and Economic Activity135 Questions
Exam 28: Monetary Policy in Canada122 Questions
Exam 29: Inflation and Disinflation123 Questions
Exam 30: Unemployment Fluctuations and the Nairu120 Questions
Exam 31: Government Debt and Deficits129 Questions
Exam 32: The Gains From International Trade127 Questions
Exam 33: Trade Policy126 Questions
Exam 34: Exchange Rates and the Balance of Payments161 Questions
Select questions type
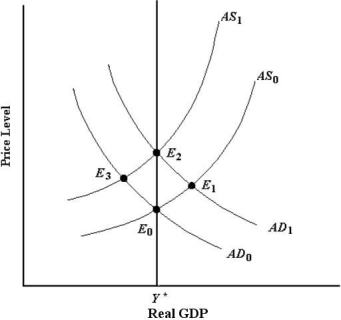 FIGURE 24-5
-Refer to Figure 24-5. If the economy is currently in equilibrium at E3, the concept of asymmetrical adjustment of the AS curve suggests that
FIGURE 24-5
-Refer to Figure 24-5. If the economy is currently in equilibrium at E3, the concept of asymmetrical adjustment of the AS curve suggests that
(Multiple Choice)
4.9/5  (44)
(44)
The ʺlong-run aggregate supply curve,ʺ vertical at Y*, shows that
(Multiple Choice)
4.8/5 (34)
The diagram below shows an AD/AS model for a hypothetical economy. The economy begins in long-run equilibrium at point A.
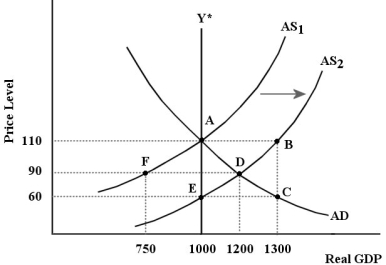 FIGURE 24-4
-Refer to Figure 24-4. The positive aggregate supply shock shown in the diagram results in a new short -run equilibrium where the price level is and real GDP is .
FIGURE 24-4
-Refer to Figure 24-4. The positive aggregate supply shock shown in the diagram results in a new short -run equilibrium where the price level is and real GDP is .
(Multiple Choice)
4.8/5 (36)
FIGURE 24-5
-Refer to Figure 24-5. Following a positive demand shock that takes the economy from E0 to E1, the movement of the economy from E1 to E2 indicates that
(Multiple Choice)
4.9/5 (41)
The diagram below shows an AD/AS model for a hypothetical economy. The economy begins in long-run equilibrium at point A.
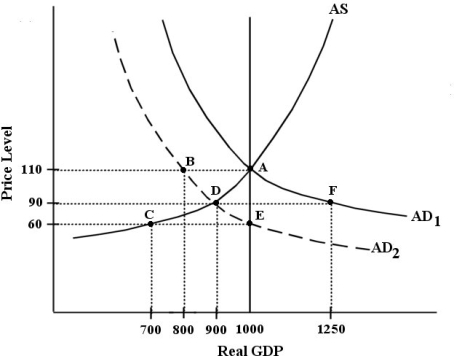 FIGURE 24-3
-Refer to Figure 24-3. Following the negative AD shock shown in the diagram from AD1 to AD2), the adjustment process will take the economy to a long-run equilibrium where the price level is and real GDP is .
FIGURE 24-3
-Refer to Figure 24-3. Following the negative AD shock shown in the diagram from AD1 to AD2), the adjustment process will take the economy to a long-run equilibrium where the price level is and real GDP is .
(Multiple Choice)
4.8/5 (32)
Consider a simple macro model with demand-determined output. Which of the following parameters will produce the largest fluctuations in real GDP from autonomous expenditure shocks?
(Multiple Choice)
4.7/5 (37)
Consider the basic AD/AS macro model in long -run equilibrium. An expansionary AD shock would have
Output effect in the short run and output effect in the long run.
(Multiple Choice)
4.8/5 (40)
Consider a simple macro model with demand-determined output. Which of the following parameters will produce the most stable real GDP in the face of autonomous expenditure shocks?
(Multiple Choice)
4.8/5 (36)
Consider the basic AD/AS model, and suppose there is a negative output gap. If an expansionary fiscal policy is pursued and the AS curve shifts leftward unexpectedly, the fiscal policy may be , and real GDP may
Potential GDP.
(Multiple Choice)
4.8/5 (38)
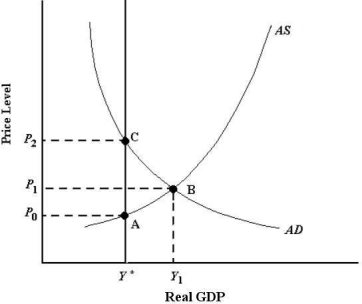 FIGURE 24-2
-Refer to Figure 24-2. Suppose the economy is in a short-run equilibrium at Y1. An appropriate fiscal policy for attaining potential output Y*) is an)
FIGURE 24-2
-Refer to Figure 24-2. Suppose the economy is in a short-run equilibrium at Y1. An appropriate fiscal policy for attaining potential output Y*) is an)
(Multiple Choice)
4.9/5 (38)
Consider the basic AD/AS macro model in long -run equilibrium. An expansionary AD shock will the price level and output in the short run. In the long run, the price level will and output will
)
(Multiple Choice)
4.8/5 (38)
The table below shows data for five economies of similar size. Real GDP is measured in billions of dollars. Assume that potential output for each economy is $340 billion. 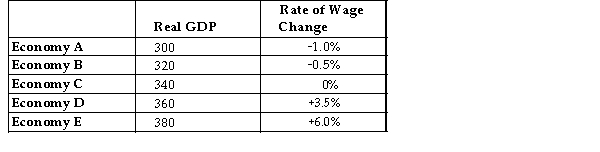 TABLE 24-1
-Refer to Table 24-1. Consider Economy E. Which of the following best describes the positions of the aggregate demand and aggregate supply curves in this economy?
TABLE 24-1
-Refer to Table 24-1. Consider Economy E. Which of the following best describes the positions of the aggregate demand and aggregate supply curves in this economy?
(Multiple Choice)
4.9/5 (26)
If the short-run macroeconomic equilibrium occurs with real GDP less than Y*, the economy is
(Multiple Choice)
4.8/5 (38)
Which of the following statements about fiscal policy is the best example of ʺgross tuningʺ?
(Multiple Choice)
4.9/5 (44)
Consider the AD/AS macro model. The study of short-run cyclical fluctuations usually assumes, for simplicity, that there are no changes in
(Multiple Choice)
4.9/5 (38)
Suppose the economy has a high level of unemployment and a low level of aggregate output. Which of the following policies could the government implement to alleviate these conditions?
(Multiple Choice)
4.8/5 (33)
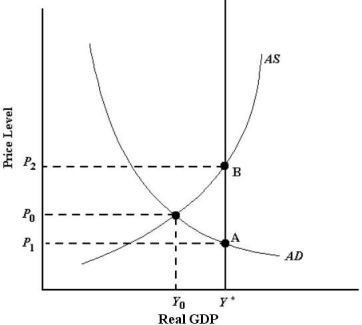 FIGURE 24-1
-Refer to Figure 24-1. If the economy is currently producing output of Y0, the economyʹs automatic adjustment process will have the
FIGURE 24-1
-Refer to Figure 24-1. If the economy is currently producing output of Y0, the economyʹs automatic adjustment process will have the
(Multiple Choice)
4.9/5 (38)
Consider the AD/AS model. Since output in the long run is determined by Y*, the only role of the AD curve is to determine the price level. This is true because
(Multiple Choice)
4.8/5 (35)
Filters
- Essay(0)
- Multiple Choice(0)
- Short Answer(0)
- True False(0)
- Matching(0)