Exam 6: Consumer Behaviour
Exam 1: Economic Issues and Concepts130 Questions
Exam 2: Economic Theories, Data, and Graphs140 Questions
Exam 3: Demand, Supply, and Price161 Questions
Exam 4: Elasticity160 Questions
Exam 5: Price Controls and Market Efficiency125 Questions
Exam 6: Consumer Behaviour140 Questions
Exam 7: Producers in the Short Run144 Questions
Exam 8: Producers in the Long Run141 Questions
Exam 9: Competitive Markets153 Questions
Exam 10: Monopoly, Cartels, and Price Discrimination126 Questions
Exam 11: Imperfect Competition and Strategic Behaviour126 Questions
Exam 12: Economic Efficiency and Public Policy123 Questions
Exam 13: How Factor Markets Work124 Questions
Exam 14: Labour Markets and Income Inequality117 Questions
Exam 16: Market Failures and Government Intervention123 Questions
Exam 17: The Economics of Environmental Protection133 Questions
Exam 18: Taxation and Public Expenditure121 Questions
Exam 19: What Macroeconomics Is All About116 Questions
Exam 20: The Measurement of National Income117 Questions
Exam 21: The Simplest Short-Run Macro Model156 Questions
Exam 22: Adding Government and Trade to the Simple Macro Model132 Questions
Exam 23: Output and Prices in the Short Run142 Questions
Exam 24: From the Short Run to the Long Run: the Adjustment of Factor Prices148 Questions
Exam 25: Long-Run Economic Growth132 Questions
Exam 26: Money and Banking119 Questions
Exam 27: Money, Interest Rates, and Economic Activity135 Questions
Exam 28: Monetary Policy in Canada122 Questions
Exam 29: Inflation and Disinflation123 Questions
Exam 30: Unemployment Fluctuations and the Nairu120 Questions
Exam 31: Government Debt and Deficits129 Questions
Exam 32: The Gains From International Trade127 Questions
Exam 33: Trade Policy126 Questions
Exam 34: Exchange Rates and the Balance of Payments161 Questions
Select questions type
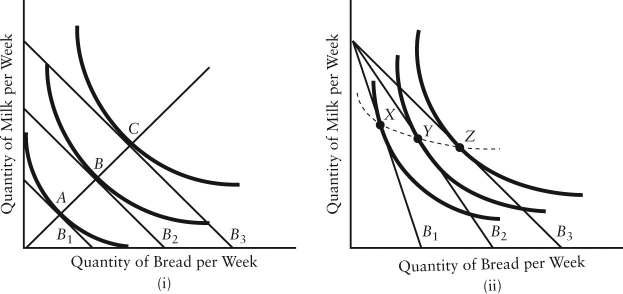 FIGURE 6-9
-Refer to Figure 6-9. In part i), the line joining points A, B, and C is known as , which shows how
)
FIGURE 6-9
-Refer to Figure 6-9. In part i), the line joining points A, B, and C is known as , which shows how
)
(Multiple Choice)
4.9/5  (38)
(38)
The table below shows the total value in dollars) that Andrew gets from playing 9-hole rounds of golf.  TABLE 6-3
-Since there is a limited supply of diamonds in the world, the consumption of diamonds
TABLE 6-3
-Since there is a limited supply of diamonds in the world, the consumption of diamonds
(Multiple Choice)
4.9/5 (47)
The diagram below shows a set of budget lines facing a household.
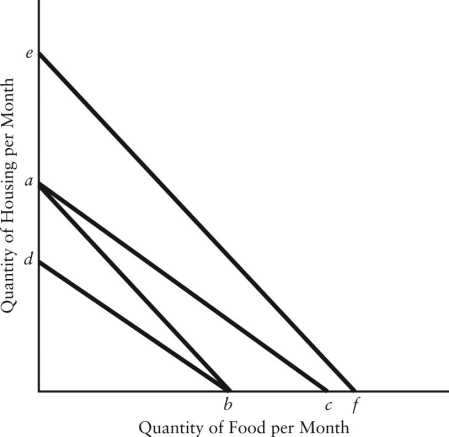 FIGURE 6-8
-Refer to Figure 6-8. The movement of the budget line from ab to db could be caused by
FIGURE 6-8
-Refer to Figure 6-8. The movement of the budget line from ab to db could be caused by
(Multiple Choice)
4.9/5 (37)
In indifference curve analysis, a point to the left of the consumerʹs budget line
(Multiple Choice)
4.9/5 (34)
The figures below show Chrisʹs consumption of specialty coffee per week.
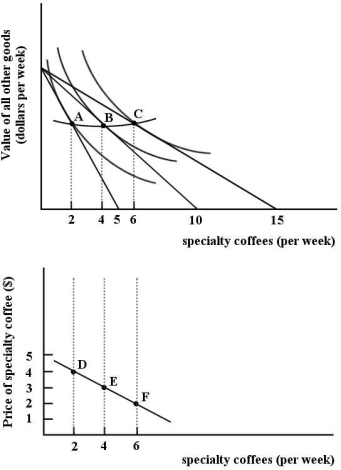 FIGURE 6-10
-Refer to Figure 6-10. Suppose Chrisʹs income is such that he is able to buy no more than 10 specialty coffees per week. If Chris is maximizing his utility at this level of income, how many specialty coffees is he consuming per week?
FIGURE 6-10
-Refer to Figure 6-10. Suppose Chrisʹs income is such that he is able to buy no more than 10 specialty coffees per week. If Chris is maximizing his utility at this level of income, how many specialty coffees is he consuming per week?
(Multiple Choice)
4.9/5 (43)
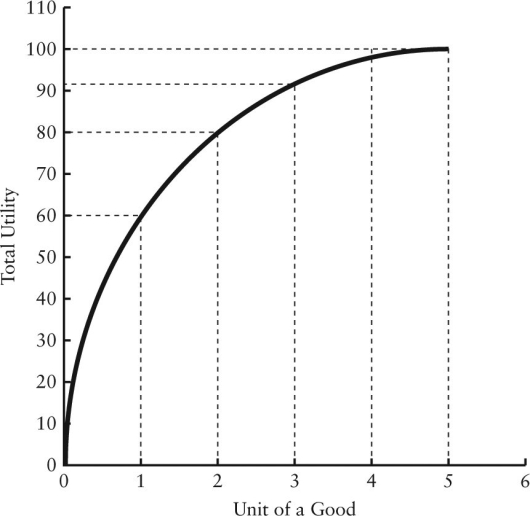 FIGURE 6-1
-Refer to Figure 6-1. Marginal utility is zero when total utility is
FIGURE 6-1
-Refer to Figure 6-1. Marginal utility is zero when total utility is
(Multiple Choice)
4.8/5 (37)
If consumption of an extra unit of a product delivers a positive marginal utility, then consumption of that additional unit would mean
(Multiple Choice)
4.9/5 (39)
The table below shows the quantities of toffee bars and bags of cashews that a consumer could consume over a 1-week period. 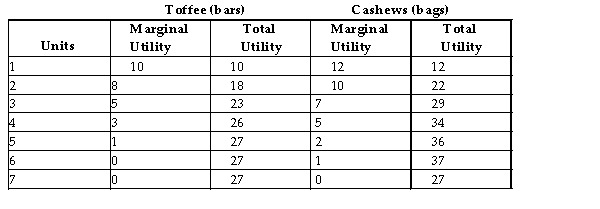 TABLE 6-1
-Refer to Table 6-1. The maximum utility that a consumer can obtain from toffee bars and bags of cashews per week is
TABLE 6-1
-Refer to Table 6-1. The maximum utility that a consumer can obtain from toffee bars and bags of cashews per week is
(Multiple Choice)
4.9/5 (41)
Assume a person reveals the following demand conditions. At a price of $10, quantity demanded is zero; and at a price of $1, quantity demanded is 10 units.
(Multiple Choice)
4.7/5 (32)
Given a particular market demand curve, consumer surplus is
(Multiple Choice)
4.9/5 (38)
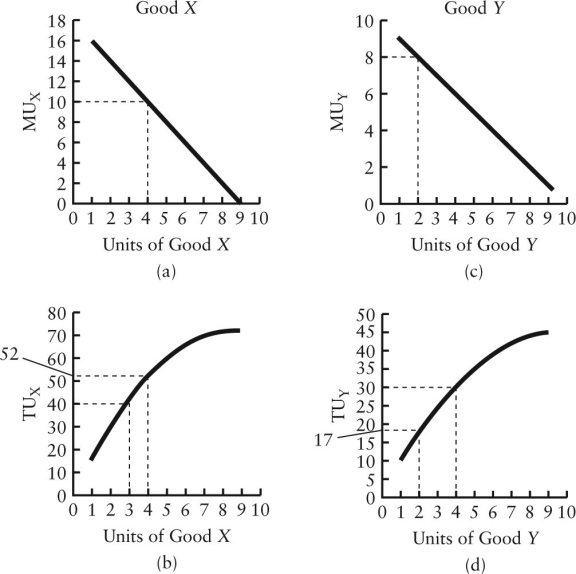 FIGURE 6-2
-Marginal utility analysis predicts a downward-sloping demand curve for good X because
FIGURE 6-2
-Marginal utility analysis predicts a downward-sloping demand curve for good X because
(Multiple Choice)
4.8/5 (47)
Daveʹs Consumer Surplus on Movie Rentals per Week
yes, we know no one rents movies anymore, but it makes a good example!)
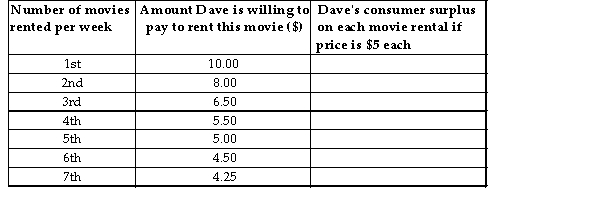 TABLE 6-2
-Refer to Table 6-2. How many movies will Dave rent per week such that the consumer surplus on the last unit is zero?
TABLE 6-2
-Refer to Table 6-2. How many movies will Dave rent per week such that the consumer surplus on the last unit is zero?
(Multiple Choice)
4.7/5 (34)
FIGURE 6-9
-Refer to Figure 6-9. In part ii), the consumerʹs move from point Z to point Y is caused by
(Multiple Choice)
4.9/5 (34)
Suppose the price of potatoes falls and we observe a decrease in an individualʹs purchases of potatoes. Which of the following can we infer?
(Multiple Choice)
4.9/5 (30)
The table below shows the quantities of toffee bars and bags of cashews that a consumer could consume over a 1-week period. TABLE 6-1
-Refer to Table 6-1. If the price of toffee bars is $1 each, bags of cashews are $2 each, and this consumer has $7 per week to spend on these two snacks, how many of each will he/she purchase to maximize utility?
(Multiple Choice)
4.7/5 (33)
Consider the substitution and income effects of a 15% increase in the price of a good. Of the goods listed below, which is most likely to have the smallest income effect?
(Multiple Choice)
4.8/5 (36)
Sophie consumes two goods paperback novels and visits to the movies.
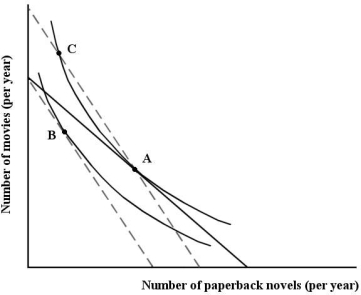 FIGURE 6-12
-Refer to Figure 6-12. Sophieʹs movement from point A to point C is
FIGURE 6-12
-Refer to Figure 6-12. Sophieʹs movement from point A to point C is
(Multiple Choice)
4.7/5 (37)
FIGURE 6-2
-Consider a consumer who divides his income between spending on good X and good Y. The opportunity cost of good X in terms of good Y is reflected by the
(Multiple Choice)
4.9/5 (38)
At a garage sale, Dominique purchases a sewing machine for $30 when she was willing to pay $55. If the sewing machine costs $200 new, Dominiqueʹs consumer surplus would be
(Multiple Choice)
4.8/5 (38)
Diagrams A, B, and C show 3 individual consumersʹ demand curves for cement. Consumers A, B, and C constitute the entire monthly cement market in this region.
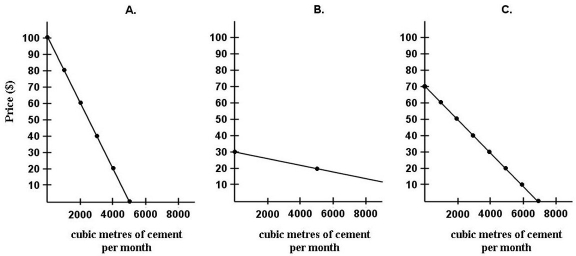 FIGURE 6-3
-Consider the income and substitution effects of price changes. The substitution effect is the change in quantity demanded that occurs
FIGURE 6-3
-Consider the income and substitution effects of price changes. The substitution effect is the change in quantity demanded that occurs
(Multiple Choice)
5.0/5 (40)
Filters
- Essay(0)
- Multiple Choice(0)
- Short Answer(0)
- True False(0)
- Matching(0)