Exam 6: Consumer Behaviour
Exam 1: Economic Issues and Concepts130 Questions
Exam 2: Economic Theories, Data, and Graphs140 Questions
Exam 3: Demand, Supply, and Price161 Questions
Exam 4: Elasticity160 Questions
Exam 5: Price Controls and Market Efficiency125 Questions
Exam 6: Consumer Behaviour140 Questions
Exam 7: Producers in the Short Run144 Questions
Exam 8: Producers in the Long Run141 Questions
Exam 9: Competitive Markets153 Questions
Exam 10: Monopoly, Cartels, and Price Discrimination126 Questions
Exam 11: Imperfect Competition and Strategic Behaviour126 Questions
Exam 12: Economic Efficiency and Public Policy123 Questions
Exam 13: How Factor Markets Work124 Questions
Exam 14: Labour Markets and Income Inequality117 Questions
Exam 16: Market Failures and Government Intervention123 Questions
Exam 17: The Economics of Environmental Protection133 Questions
Exam 18: Taxation and Public Expenditure121 Questions
Exam 19: What Macroeconomics Is All About116 Questions
Exam 20: The Measurement of National Income117 Questions
Exam 21: The Simplest Short-Run Macro Model156 Questions
Exam 22: Adding Government and Trade to the Simple Macro Model132 Questions
Exam 23: Output and Prices in the Short Run142 Questions
Exam 24: From the Short Run to the Long Run: the Adjustment of Factor Prices148 Questions
Exam 25: Long-Run Economic Growth132 Questions
Exam 26: Money and Banking119 Questions
Exam 27: Money, Interest Rates, and Economic Activity135 Questions
Exam 28: Monetary Policy in Canada122 Questions
Exam 29: Inflation and Disinflation123 Questions
Exam 30: Unemployment Fluctuations and the Nairu120 Questions
Exam 31: Government Debt and Deficits129 Questions
Exam 32: The Gains From International Trade127 Questions
Exam 33: Trade Policy126 Questions
Exam 34: Exchange Rates and the Balance of Payments161 Questions
Select questions type
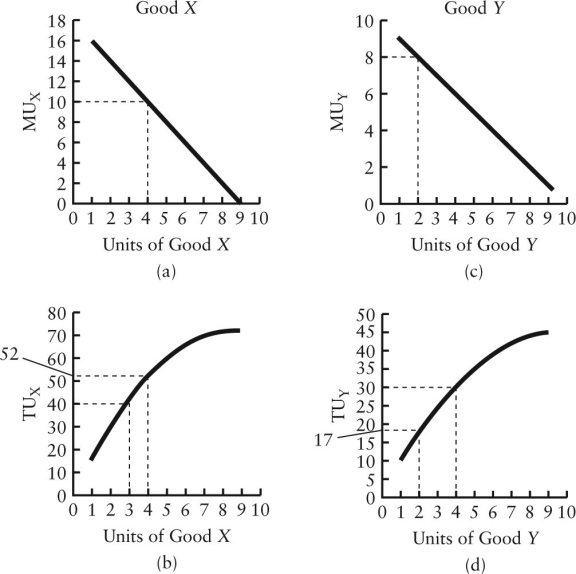 FIGURE 6-2
-Refer to Figure 6-2. Suppose that the price of Y is $1 and the consumerʹs income is $10. Initially, the price of X is $2 and the consumer is buying 4 units of good Y. If the price of X then falls to $1, which of the following pairs of quantities of X correctly completes the demand schedule below?
FIGURE 6-2
-Refer to Figure 6-2. Suppose that the price of Y is $1 and the consumerʹs income is $10. Initially, the price of X is $2 and the consumer is buying 4 units of good Y. If the price of X then falls to $1, which of the following pairs of quantities of X correctly completes the demand schedule below? 
(Multiple Choice)
4.8/5  (40)
(40)
The figures below show Chrisʹs consumption of specialty coffee per week.
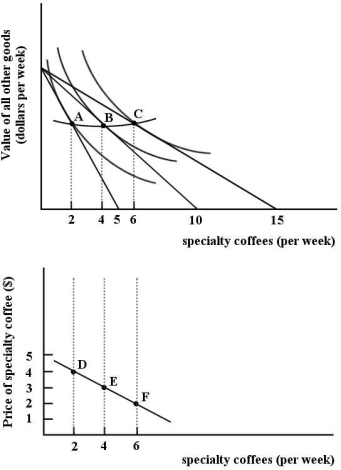 FIGURE 6-10
-Refer to Figure 6-10. The line connecting points A, B and C is . The line connecting points D, E and F is .
FIGURE 6-10
-Refer to Figure 6-10. The line connecting points A, B and C is . The line connecting points D, E and F is .
(Multiple Choice)
4.9/5 (28)
Assume you are consuming two goods, X and Y. Suppose the absolute prices for X and Y remain unchanged, but your money income falls by 50%. What happens to your consumption of good X?
(Multiple Choice)
4.9/5 (36)
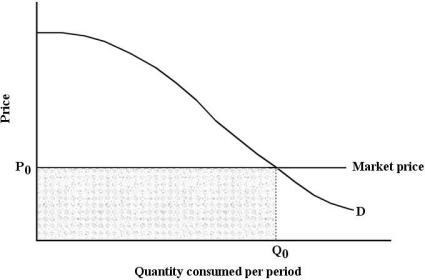 FIGURE 6-7
-Refer to Figure 6-7. Suppose that price is P0. Total consumer surplus is then given by the area
FIGURE 6-7
-Refer to Figure 6-7. Suppose that price is P0. Total consumer surplus is then given by the area
(Multiple Choice)
4.8/5 (33)
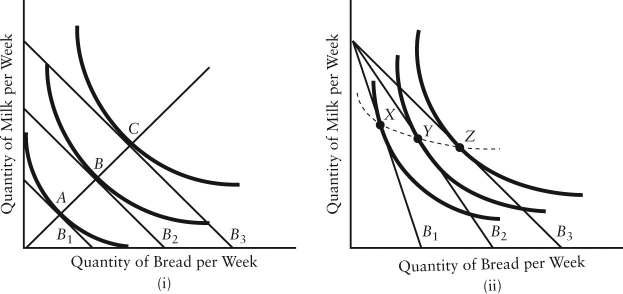 FIGURE 6-9
-Refer to Figure 6-9. In part i), the consumer is able to move from point A to point B because of
FIGURE 6-9
-Refer to Figure 6-9. In part i), the consumer is able to move from point A to point B because of
(Multiple Choice)
4.8/5 (39)
A consumer maximizes his or her utility when expenditures are allocated such that
(Multiple Choice)
4.8/5 (48)
 FIGURE 6-5
-Refer to Figure 6-5. For both goods, the price increases from P0 to P1. The substitution effect is illustrated by the change in quantity demanded from A to B; the income effect is illustrated by the change in quantity demanded from B to C. Good Y is certainly an) good.
FIGURE 6-5
-Refer to Figure 6-5. For both goods, the price increases from P0 to P1. The substitution effect is illustrated by the change in quantity demanded from A to B; the income effect is illustrated by the change in quantity demanded from B to C. Good Y is certainly an) good.
(Multiple Choice)
4.8/5 (33)
If all consumers in an economy have maximized their utility, and they face a given set of market prices, then each consumer will have identical
(Multiple Choice)
4.7/5 (27)
Suppose a utility-maximizing person consumes only two goods, hamburgers and milkshakes. Suppose the price of milkshakes rises and all other variables remain constant. As a result, this person will certainly
(Multiple Choice)
4.8/5 (37)
An indifference curve plotted for two different goods on the axes
(Multiple Choice)
5.0/5 (38)
The ʺlawʺ of diminishing marginal utility implies that the
(Multiple Choice)
4.9/5 (31)
FIGURE 6-2
-Refer to Figure 6-2. Suppose that the price of X is $2, the price of Y is $1, the consumerʹs income is $10, and the consumer is buying 3 units of good X and 4 units of good Y. What is the total utility the consumer obtains from this combination of X and Y?
(Multiple Choice)
4.7/5 (43)
FIGURE 6-7
-Refer to Figure 6-7. Suppose that price is P0. The market value of the quantity purchased is given by the area
(Multiple Choice)
4.8/5 (40)
Assume the quantity of good X is measured on the horizontal axis and the quantity of good Y on the vertical axis. Initial prices are PX = $5 and PY = $10. The consumerʹs income is $100. If PY increases to $20, then
(Multiple Choice)
5.0/5 (38)
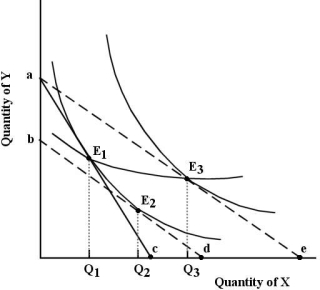 FIGURE 6-11
-Refer to Figure 6-11. The line joining points E1 and E3 is known as , which shows how .
FIGURE 6-11
-Refer to Figure 6-11. The line joining points E1 and E3 is known as , which shows how .
(Multiple Choice)
4.8/5 (36)
FIGURE 6-2
-The Smith family is allocating its monthly household expenditure between only two goods, food and clothing. Suppose that the price of food is $12 per unit, and the price of clothing is $16 per unit and that the marginal utility that the family is receiving from its consumption of clothing is currently 200. What is the familyʹs marginal utility from its consumption of food if it is maximizing its utility?
(Multiple Choice)
4.7/5 (30)
The diagram below shows a set of budget lines facing a household.
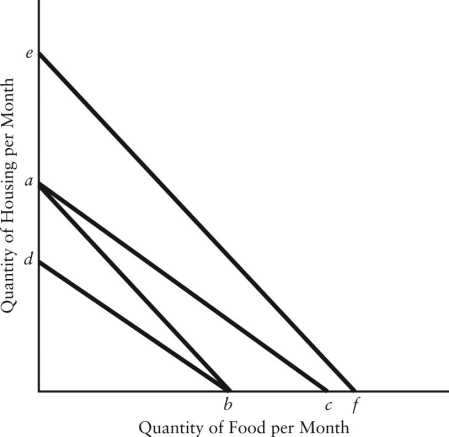 FIGURE 6-8
-Refer to Figure 6-8. The movement of the budget line from ab to ef could be caused by
FIGURE 6-8
-Refer to Figure 6-8. The movement of the budget line from ab to ef could be caused by
(Multiple Choice)
4.9/5 (38)
The table below shows the quantities of toffee bars and bags of cashews that a consumer could consume over a 1-week period. 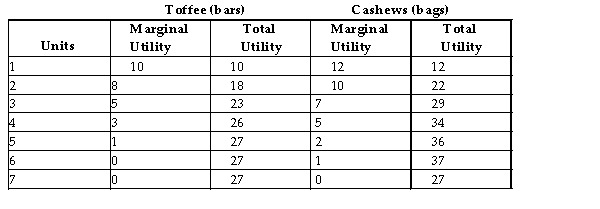 TABLE 6-1
-Refer to Table 6-1. If this consumer purchases 3 toffee bars and 4 bags of cashews per week, his/her total utility will be
TABLE 6-1
-Refer to Table 6-1. If this consumer purchases 3 toffee bars and 4 bags of cashews per week, his/her total utility will be
(Multiple Choice)
4.7/5 (42)
In which of the following situations will an individualʹs purchasing power be unaffected?
(Multiple Choice)
4.9/5 (36)
FIGURE 6-2
-Refer to Figure 6-2. Suppose the price of Y is $1, the consumerʹs income is $10, and the consumer is currently buying 3 units of good X and 4 units of good Y. If this consumer is maximizing her utility, then the price of X must be
(Multiple Choice)
4.8/5 (42)
Filters
- Essay(0)
- Multiple Choice(0)
- Short Answer(0)
- True False(0)
- Matching(0)