Exam 10: Aggregate Supply and Aggregate Demand
Exam 1: What Is Economics170 Questions
Exam 2: The Economic Problem145 Questions
Exam 3: Demand and Supply185 Questions
Exam 4: Measuring Gdp and Economic Growth126 Questions
Exam 5: Monitoring Jobs and Inflation113 Questions
Exam 6: Economic Growth95 Questions
Exam 7: Finance, Saving, and Investment138 Questions
Exam 8: Money, the Price Level, and Inflation129 Questions
Exam 9: The Exchange Rate and the Balance of Payments121 Questions
Exam 10: Aggregate Supply and Aggregate Demand129 Questions
Exam 11: Expenditure Multipliers166 Questions
Exam 12: The Business Cycle, Inflation, and Deflation105 Questions
Exam 13: Fiscal Policy96 Questions
Exam 14: Monetary Policy93 Questions
Exam 15: International Trade Policy119 Questions
Select questions type
Use the figure below to answer the following questions.
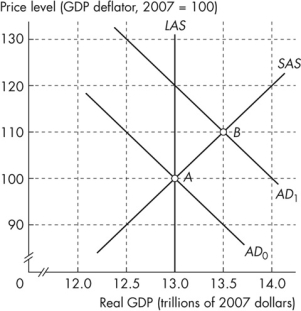 Figure 10.3.5
-Refer to Figure 10.3.5.Potential GDP is
Figure 10.3.5
-Refer to Figure 10.3.5.Potential GDP is
(Multiple Choice)
4.9/5  (34)
(34)
Which of the following statements about the monetarist view of the macroeconomy is incorrect?
(Multiple Choice)
4.9/5 (36)
Canada's exports to the European Union boom.What is the effect on the quantity of real GDP demanded or aggregate demand in Canada?
(Multiple Choice)
4.9/5 (38)
Use the figure below to answer the following questions.
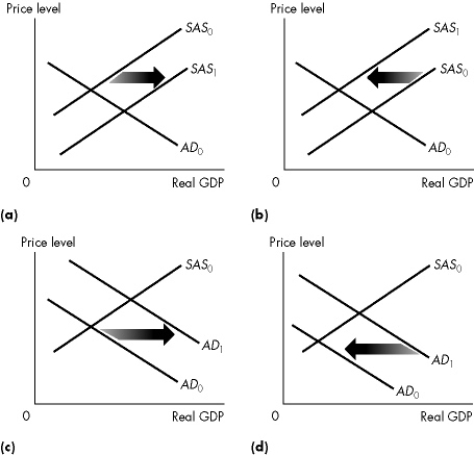 Figure 10.2.1
-Refer to Figure 10.2.1.Which graph illustrates the effect of an increase in the quantity of money?
Figure 10.2.1
-Refer to Figure 10.2.1.Which graph illustrates the effect of an increase in the quantity of money?
(Multiple Choice)
4.9/5 (28)
Use the figure below to answer the following questions.
Figure 10.3.5
-Refer to Figure 10.3.5.When the economy is at full employment, real GDP is
(Multiple Choice)
4.9/5 (40)
Use the figure below to answer the following questions.
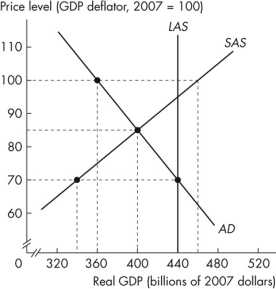 Figure 10.3.1
-Refer to Figure 10.3.1.Short- run macroeconomic equilibrium real GDP is
Figure 10.3.1
-Refer to Figure 10.3.1.Short- run macroeconomic equilibrium real GDP is
(Multiple Choice)
4.8/5 (31)
Which one of the following newspaper quotations describes a rightward shift of the LAS curve?
(Multiple Choice)
4.8/5 (35)
Which one of the following newspaper quotations describes a movement along an LAS curve?
(Multiple Choice)
4.9/5 (45)
Use the figure below to answer the following questions.
Figure 10.3.5
-Refer to Figure 10.3.5.The shift of the aggregate demand curve from AD0 to AD1 might have been the result of
(Multiple Choice)
5.0/5 (42)
We observe an increase in the price level and a decrease in real GDP.Which of the following is a possible explanation?
(Multiple Choice)
4.8/5 (44)
When an economy is operating on its long- run aggregate supply curve,
(Multiple Choice)
4.8/5 (36)
Use the table below to answer the following questions.
Table 10.3.1
 -Refer to Table 10.3.1.The economy eventually moves to its long- run equilibrium.In long- run equilibrium, the price level is _______ and real GDP is _______ billion.
(Multiple Choice)
4.7/5 (34)
If real GDP is less than potential GDP, then the economy is
(Multiple Choice)
4.8/5 (41)
Use the figure below to answer the following questions.
Figure 10.3.5
-Refer to Figure 10.3.5.At point B the economy has
(Multiple Choice)
4.9/5 (40)
Long- run aggregate supply will increase for all of the following reasons except
(Multiple Choice)
4.9/5 (34)
Filters
- Essay(0)
- Multiple Choice(0)
- Short Answer(0)
- True False(0)
- Matching(0)