Exam 10: Aggregate Supply and Aggregate Demand
Exam 1: What Is Economics170 Questions
Exam 2: The Economic Problem145 Questions
Exam 3: Demand and Supply185 Questions
Exam 4: Measuring Gdp and Economic Growth126 Questions
Exam 5: Monitoring Jobs and Inflation113 Questions
Exam 6: Economic Growth95 Questions
Exam 7: Finance, Saving, and Investment138 Questions
Exam 8: Money, the Price Level, and Inflation129 Questions
Exam 9: The Exchange Rate and the Balance of Payments121 Questions
Exam 10: Aggregate Supply and Aggregate Demand129 Questions
Exam 11: Expenditure Multipliers166 Questions
Exam 12: The Business Cycle, Inflation, and Deflation105 Questions
Exam 13: Fiscal Policy96 Questions
Exam 14: Monetary Policy93 Questions
Exam 15: International Trade Policy119 Questions
Select questions type
Use the figure below to answer the following questions.
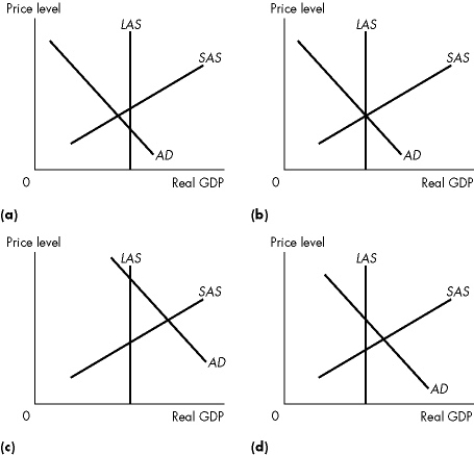 Figure 10.3.3
-Refer to Figure 10.3.3.Which of the graphs illustrates a below full- employment equilibrium?
Figure 10.3.3
-Refer to Figure 10.3.3.Which of the graphs illustrates a below full- employment equilibrium?
(Multiple Choice)
4.9/5  (39)
(39)
Use the table below to answer the following questions.
Table 10.3.3
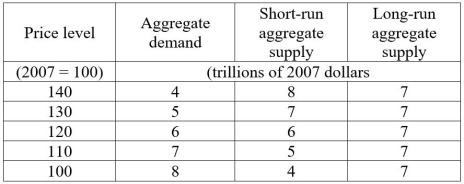 -Refer to Table 10.3.3.When the economy is at its short- run macroeconomic equilibrium, the economy
(Multiple Choice)
4.8/5 (34)
We observe an increase in the price level and an increase in real GDP.Which of the following is a possible explanation?
(Multiple Choice)
4.7/5 (40)
The quantity of real GDP demanded does not depend on decisions made by
(Multiple Choice)
4.9/5 (43)
Use the table below to answer the following questions.
Table 10.3.3
-Refer to Table 10.3.3.With no interference from the central bank or the government, the
(Multiple Choice)
4.7/5 (43)
When the actual unemployment rate is equal to the natural unemployment rate, then the
(Multiple Choice)
4.8/5 (40)
The defining feature of the Keynesian view of macroeconomics is
(Multiple Choice)
4.8/5 (41)
Which one of the following factors will not shift the aggregate demand curve?
(Multiple Choice)
4.9/5 (41)
The economy cannot remain indefinitely with real GDP greater than potential GDP because the money wage rate will
(Multiple Choice)
4.7/5 (41)
Consider the following events: Event 1: Growth in the world economy slows.Event 2: The world price of oil rises.
Event 3: Canadian labour productivity declines.Choose the statement that is correct.
(Multiple Choice)
4.9/5 (39)
Which one of the following is a reason for the negative slope of the aggregate demand curve?
(Multiple Choice)
4.8/5 (45)
Short- run macroeconomic equilibrium always occurs when the
(Multiple Choice)
4.8/5 (35)
If factor prices remain constant, an increase in aggregate demand
(Multiple Choice)
4.8/5 (40)
Use the figure below to answer the following questions.
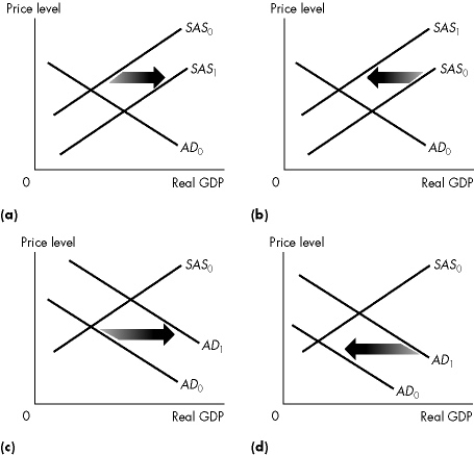 Figure 10.1.1
-Refer to Figure 10.1.1.Which graph illustrates the effect of an increase in factor prices?
Figure 10.1.1
-Refer to Figure 10.1.1.Which graph illustrates the effect of an increase in factor prices?
(Multiple Choice)
5.0/5 (38)
Use the table below to answer the following questions.
Table 10.3.1
 -Refer to Table 10.3.1.There is
(Multiple Choice)
4.8/5 (37)
Canadian firms build new pipelines across the nation.What is the effect on the quantity of real GDP demanded or aggregate demand in Canada?
(Multiple Choice)
4.9/5 (42)
Toyota and Honda build additional plants in Canada.This event _______ short- run aggregate supply and _______ long- run aggregate supply.
(Multiple Choice)
4.9/5 (36)
Filters
- Essay(0)
- Multiple Choice(0)
- Short Answer(0)
- True False(0)
- Matching(0)