Exam 10: Aggregate Supply and Aggregate Demand
Exam 1: What Is Economics170 Questions
Exam 2: The Economic Problem145 Questions
Exam 3: Demand and Supply185 Questions
Exam 4: Measuring Gdp and Economic Growth126 Questions
Exam 5: Monitoring Jobs and Inflation113 Questions
Exam 6: Economic Growth95 Questions
Exam 7: Finance, Saving, and Investment138 Questions
Exam 8: Money, the Price Level, and Inflation129 Questions
Exam 9: The Exchange Rate and the Balance of Payments121 Questions
Exam 10: Aggregate Supply and Aggregate Demand129 Questions
Exam 11: Expenditure Multipliers166 Questions
Exam 12: The Business Cycle, Inflation, and Deflation105 Questions
Exam 13: Fiscal Policy96 Questions
Exam 14: Monetary Policy93 Questions
Exam 15: International Trade Policy119 Questions
Select questions type
Use the figure below to answer the following questions.
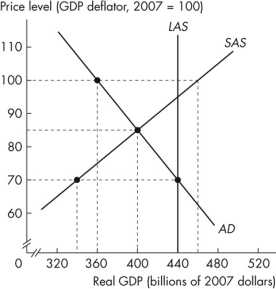 Figure 10.3.1
-Refer to Figure 10.3.1.The economy automatically adjusts to a long- run equilibrium.At the long- run macroeconomic equilibrium,
Figure 10.3.1
-Refer to Figure 10.3.1.The economy automatically adjusts to a long- run equilibrium.At the long- run macroeconomic equilibrium,
(Multiple Choice)
4.8/5  (27)
(27)
Use the figure below to answer the following questions.
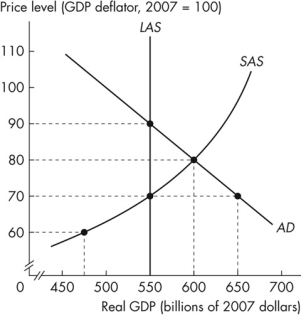 Figure 10.3.2
-Refer to Figure 10.3.2.Currently in the economy
Figure 10.3.2
-Refer to Figure 10.3.2.Currently in the economy
(Multiple Choice)
4.9/5 (34)
Which one of the following variables is not held constant along a given aggregate demand curve?
(Multiple Choice)
4.9/5 (38)
Which of the following situations illustrates how fiscal policy can influence aggregate demand?
(Multiple Choice)
4.8/5 (32)
A _______macroeconomist believes that business cycle fluctuations are the efficient responses of a well- functioning market economy that is bombarded by shocks that arise from the uneven pace of technological change.A _______ macroeconomist believes that the short- run aggregate supply curve is horizontal at a fixed price level.
(Multiple Choice)
4.9/5 (36)
Everything else remaining the same, an increase in the expected inflation rate
(Multiple Choice)
4.9/5 (36)
Use the figure below to answer the following questions.
Figure 10.3.2
-Refer to Figure 10.3.2.There is a difference between the _______ equilibrium real GDP and potential GDP of _______ billion.
(Multiple Choice)
4.9/5 (28)
Use the figure below to answer the following questions.
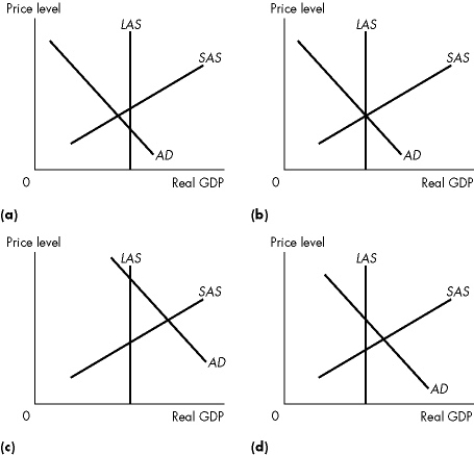 Figure 10.3.3
-Refer to Figure 10.3.3.In which of the graphs would we predict that eventually the price level will fall and real GDP will decrease, everything else remaining the same?
Figure 10.3.3
-Refer to Figure 10.3.3.In which of the graphs would we predict that eventually the price level will fall and real GDP will decrease, everything else remaining the same?
(Multiple Choice)
4.8/5 (36)
Which one of the following newspaper quotations describes a leftward shift of the LAS curve?
(Multiple Choice)
4.8/5 (38)
We observe a decrease in the price level and a decrease in real GDP.Which of the following is a possible explanation?
(Multiple Choice)
4.8/5 (29)
Use the figure below to answer the following questions.
Figure 10.3.2
-Refer to Figure 10.3.2.Short- run macroeconomic equilibrium real GDP is _______ billion.
(Multiple Choice)
4.8/5 (34)
Use the table below to answer the following questions.
Table 10.3.3
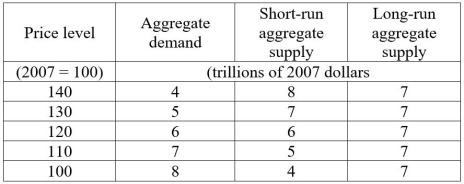 -Refer to Table 10.3.3.With no interference from the central bank or the government, the
(Multiple Choice)
4.7/5 (42)
Suppose that the E.U.economy goes into an expansion.Canadian real GDP _______ and Canadian unemployment _______ in the short run.
(Multiple Choice)
4.8/5 (41)
Use the figure below to answer the following questions.
Figure 10.3.1
-Refer to Figure 10.3.1.When this economy is in short- run macroeconomic equilibrium, the price level is
(Multiple Choice)
4.9/5 (43)
Use the figure below to answer the following questions.
Figure 10.3.3
-Refer to Figure 10.3.3.Which of the graphs illustrates a full- employment equilibrium?
(Multiple Choice)
4.8/5 (31)
Everything else remaining the same, an increase in foreign income
(Multiple Choice)
4.8/5 (36)
Use the figure below to answer the following questions.
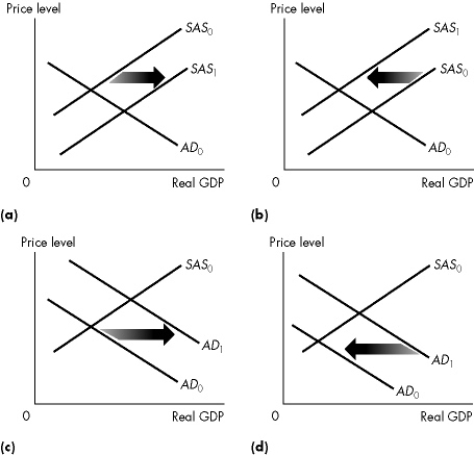 Figure 10.2.1
-Refer to Figure 10.2.1.Which graph illustrates the effect of a decrease in government expenditure?
Figure 10.2.1
-Refer to Figure 10.2.1.Which graph illustrates the effect of a decrease in government expenditure?
(Multiple Choice)
4.9/5 (41)
Filters
- Essay(0)
- Multiple Choice(0)
- Short Answer(0)
- True False(0)
- Matching(0)