Exam 16: A: Long-Run Macroeconomic Adjustments
Explain the Phillips Curve concept and construct an example of the curve on the below graph. 
The Phillips Curve concept shows a stable inverse relationship between the rate of unemployment and the rate of inflation.It is based on the idea that as aggregate demand increases when real GDP is relatively low, unemployment will decline and real GDP will rise with little or no inflationary effect.However, as aggregate demand continues to grow and the unemployment rate approaches full-employment, the price level and real GDP will increase.
Describe cost-push inflation in the long-run aggregate demand-aggregate supply model.Explain the policy dilemma for government policy if no action is taken and if monetary and fiscal policies are used to counter the cost-push inflation.Assume that the economy is initially at the full-employment level of real GDP.
Cost-push inflation is caused by an increase in the price of a major resource such as oil.In the short run, an increase in the price of a resource will shift the short-run aggregate supply curve to the left.This in turn will lead to a new short run equilibrium at a higher price level and a lower level of real output.
If the government takes no action to counter the inflation, then a recession will occur that will lead to higher levels of unemployment.At some point, the price of the major resource that caused the inflation will decline along with nominal wages (because of the recession), so that the short-run aggregate supply curve shifts back to its original position.
If the government tries to counter the cost-push inflation and recession by using stimulative monetary and fiscal policies, the aggregate demand curve will shift to the right.Employment and real output will return to their full-employment levels, but the price level will now be even higher.The higher price level is likely to kick off another round of demands to increase nominal wages that will cause another leftward shift in the short-run aggregate supply curve.Thus, an inflationary spiral can result from government actions to increase aggregate demand to counter cost-push inflation.
Why is the difference between the actual and expected rates of inflation important for explaining falling inflation?
When the actual rate of inflation is lower than the expected rate of inflation, profits temporarily fall because the prices that firms charge for their products are falling faster than wage rates.(The nominal wage rates were based on a higher expected rate of inflation than actually existed.) With less revenue, firms cannot afford to employ as many workers so the unemployment rate temporarily rises.In the long run, firms and workers adjust their expectations to the new lower rate of inflation.This means that the increase in nominal wages falls and the profits of firms rise.Firms can afford to hire more workers, so the unemployment rate falls and returns to its natural rate.
Answer the questions based on the following diagram. 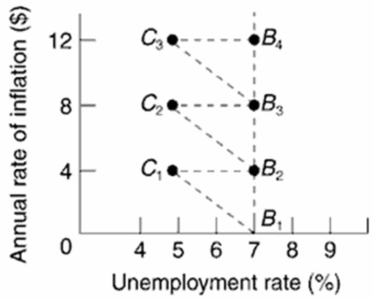 (a) Assume the economy is initially at point B1 and there is an increase in aggregate demand, which results in a 4% increase in prices.Describe the short-run and long-run outcomes that would result in this economy.(b) Assume the economy is initially at point B2, and there is an increase in aggregate demand.What will happen in the economy? Explain, using the graph.(c) Based on this diagram, what would the prediction be for the natural (full-employment) rate of unemployment?
Compare and contrast the short-run Phillips Curve and the long-run Phillips Curve.
Explain what happens in the long-run aggregate demand-aggregate supply model when there is a recession.Assume that the economy is initially at the full-employment level of real GDP.
Describe the characteristics of the short-run aggregate supply curve.Explain what happens to: (1) nominal wages; (2) real wages profits as the price level increases from the full-employment level of output.Then explain what happens to these variables as the price level decreases from the full-employment-level of output.
(a) Using a graph showing aggregate demand, short-run aggregate supply, and long-run aggregate supply, illustrate an economy that faces a recessionary gap.  (b) Explain how the recessionary gap can be eliminated and evaluate the possibilities.
What is the Laffer Curve? Explain the relationship that is shown in the curve.
Why is the difference between the actual and expected rates of inflation important for explaining rising inflation?
If the Phillips Curve exists in reality, what dilemma does this create for fiscal and monetary policies? Explain.
What is stagflation and what was one of its causes in the 1970s and early 1980s?
Using the Sherwood Forest example from the text, explain the Laffer curve.
Suppose the potential level of real GDP for a hypothetical economy is $250 and the price level (P) initially is 100.Use the following short-run aggregate supply schedules below to answer the questions.  (a) What will be the short-run level of real GDP if the price level rises unexpectedly from 100 to 110 because of an increase in aggregate demand? Falls unexpectedly from 100 to 90 because of a decrease in aggregate demand? Explain each situation.(b) What will be the long-run level of real GDP when the price level rises from 100 to 110? Falls from 100 to 90? Explain each situation.
What contributed to stagflation's demise between 1982 and 1989? How did these events affect aggregate supply and the Phillips Curve?
Suppose the potential level of real GDP for a hypothetical economy is $160 and the price level (P) initially is 200.Use the following short-run aggregate supply schedules to answer the questions.  (a) What will be the short-run level of real GDP if the price level rises unexpectedly from 200 to 210 because of an increase in aggregate demand? Falls unexpectedly from 200 to 190 because of a decrease in aggregate demand? Explain each situation.(b) What will be the long-run level of real GDP when the price level rises from 200 to 210? Falls from 200 to 190? Explain each situation.
What is the basic difference between the short run and long run as these terms relate to macroeconomics? Why does this difference occur?
Differentiate between "demand-pull" and "cost-push" inflation using the aggregate demand-aggregate supply model.
Filters
- Essay(0)
- Multiple Choice(0)
- Short Answer(0)
- True False(0)
- Matching(0)