Exam 12: A: Aggregate Demand and Aggregate Supply
Differentiate between "demand-pull" and "cost-push" inflation using the aggregate demand-aggregate supply (short-run) model.
Demand-pull inflation occurs when an increase in aggregate demand pulls up the price level.Graphically, the aggregate demand curve is shifting rightward.Cost-push inflation is a result of a decrease in short-run aggregate supply.Graphically, the short-run aggregate supply curve is shifting leftward.
Using the aggregate demand-aggregate supply (short-run) model, explain how a reduction in business taxes would affect the economy.
A reduction in business taxes affects both aggregate demand and short-run aggregate supply.On the aggregate demand side, lower business taxes increase the profitability of investment.Therefore, the aggregate demand curve shifts to the right.However, lower business taxes also affect the legal-institutional setting in which firms operates by lowering per-unit production costs.As a result, the short-run aggregate supply curve also shifts to the right.The net effect of the two changes is to increase real GDP.The price level, however, may be higher or lower depending on the relative sizes of the shifts.If aggregate demand increases more than short-run aggregate supply, then the price level is higher.If short-run aggregate supply increases more than aggregate demand, then the price level is lower.
Explain the relationship between the aggregate expenditures model in graph (A) below and the aggregate demand model in graph (B) below where aggregate demand is shifting. 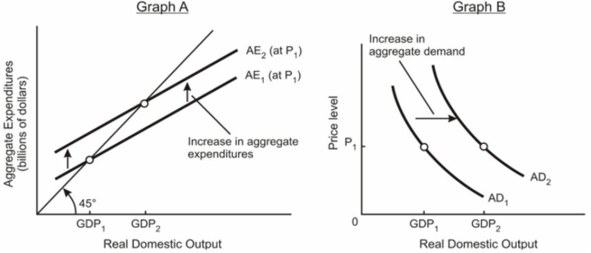
In (A) we assume that some determinant of consumption, investment, or net exports other than the price level shifts the aggregate expenditures schedule from AE1 (at P1) to AE2 (at P1), thereby increasing real domestic output from GDP1 to GDP2.In (B) we find that the aggregate demand counterpart of this is a rightward shift of the aggregate demand curve from AD1 to AD2 which is just sufficient to show the same increase in real output as in the expenditures-output model.
What is the difference in the explanation of the shape of the aggregate demand curve and a single product demand curve? After all, both demand curves show an inverse relationship between price and quantity.
List four government tax or spending policy options that would shift the short-run aggregate supply curve rightward.
Would increased downward price flexibility lead to less severe or more severe recessions? Explain.
Suppose an economic advisor to the Prime Minister recommended a personal income tax increase.Indicate the expected effects on aggregate demand and on short-run aggregate supply.
Economists think of three different aggregate supply curves based upon the time frame of observation.Briefly describe each.
Why does aggregate demand shift outward by a greater amount than the initial change in spending?
List three events that would shift the short-run aggregate supply curve leftward.
What is the aggregate demand curve? What is the characteristic of its slope?
What is the effect on the multiplier when an increase in aggregate demand also causes the price level to rise?
Suppose the aggregate demand and short-run aggregate supply schedules for a hypothetical economy are as shown below:
 (a) What will be the equilibrium price and real output level in this hypothetical economy? Is this level of real GDP also the full-employment level of output? Explain.(b) Why won't a price level of 100 be the equilibrium price level? Why won't a price level of 110 index be the equilibrium price level?
(c) Suppose aggregate demand increases by $120 billion at each price level.What will be the new equilibrium price and output levels?
(d) What factors might cause aggregate demand to increase?
(e) Suppose short-run aggregate supply increases by $120 billion at each price level.What will be the new equilibrium price and output levels?
(a) What will be the equilibrium price and real output level in this hypothetical economy? Is this level of real GDP also the full-employment level of output? Explain.(b) Why won't a price level of 100 be the equilibrium price level? Why won't a price level of 110 index be the equilibrium price level?
(c) Suppose aggregate demand increases by $120 billion at each price level.What will be the new equilibrium price and output levels?
(d) What factors might cause aggregate demand to increase?
(e) Suppose short-run aggregate supply increases by $120 billion at each price level.What will be the new equilibrium price and output levels?
Is the downward price inflexibility applicable to today's economy? Why or why not?
Explain the relationship between the aggregate expenditures model in graph (A) below and the aggregate demand model in graph (B) below.In other words, explain how points 1, 2, and 3 are related to points 1', 2', and 3'. 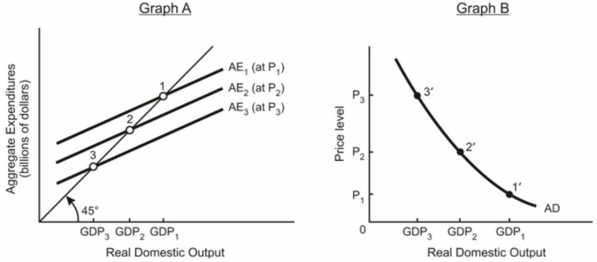
Suppose that a hypothetical economy has the following relationship between its real domestic output and the input quantities necessary for producing that level of output.  (a) What is the level of productivity in this economy?
(b) What is the unit cost of production if the price of each input is $2.00?
(c) If the input price decreases from $2 to $1.50, what is the new per unit cost of production? What impact would this have on the short-run aggregate supply curve?
(d) Suppose that instead of the input price decreasing, the productivity had increased by 25%.What will be the new unit cost of production? What impact would this change have on the short-run aggregate supply curve?
(a) What is the level of productivity in this economy?
(b) What is the unit cost of production if the price of each input is $2.00?
(c) If the input price decreases from $2 to $1.50, what is the new per unit cost of production? What impact would this have on the short-run aggregate supply curve?
(d) Suppose that instead of the input price decreasing, the productivity had increased by 25%.What will be the new unit cost of production? What impact would this change have on the short-run aggregate supply curve?
Suppose the aggregate demand and short-run aggregate supply schedules for a hypothetical economy are as shown below:
 (a) What will be the equilibrium price and real output level in this hypothetical economy? Is this level of real GDP also the full-employment level of output? Explain.(b) Why won't a price level of 110 be the equilibrium price level? Why won't a price level of 130 index be the equilibrium price level?
(c) Suppose aggregate demand increases by $400 billion at each price level.What will be the new equilibrium price and output levels?
(d) What factors might cause aggregate demand to increase?
(a) What will be the equilibrium price and real output level in this hypothetical economy? Is this level of real GDP also the full-employment level of output? Explain.(b) Why won't a price level of 110 be the equilibrium price level? Why won't a price level of 130 index be the equilibrium price level?
(c) Suppose aggregate demand increases by $400 billion at each price level.What will be the new equilibrium price and output levels?
(d) What factors might cause aggregate demand to increase?
Explain the three reasons given for the downward slope of the aggregate demand curve.
In the below diagram assume that the aggregate demand curve shifts from AD1 in year 1 to AD2 in year 2, only to fall back to AD1 in year 3. 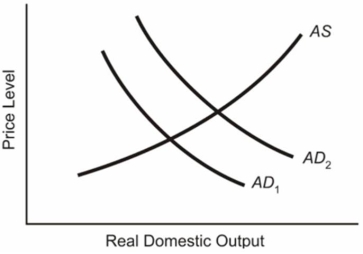 (a) Explain what will happen to the equilibrium price level and the equilibrium level of real GDP from year 1 to year 2.(b) Locate the new position in year 3 on the assumption that prices and wages are completely flexible downward.Label this position, Pb and GDPb for the price level and real GDP respectively.(c) Locate the new position in year 3 on the assumption that prices and wages are completely inflexible downward.Label this position, Pc and GDPc for the price level and real GDP respectively.
In the table below are aggregate demand and aggregate supply schedules.  (a) Suppose in Year 1, aggregate demand is shown in columns (1) and (2) in the above table and short-run aggregate supply is shown in columns (1) and (4) in the above table.What will be the equilibrium level of real GDP and the equilibrium price level?
(b) Suppose in Year 2, aggregate demand changes and is now shown in columns (1) and (3).What will be the new equilibrium level of real GDP and the new equilibrium price level?
(c) Suppose in Year 3, aggregate demand changes and is now shown again in columns (1) and (2).What will be the new level of real GDP and the new price level if prices and wages are completely flexible downward?
(d) Suppose in Year 3, aggregate demand changes and is now shown again in columns (1) and (2).What will be the new level of real GDP and the new price level if prices and wages are completely inflexible downward?
(a) Suppose in Year 1, aggregate demand is shown in columns (1) and (2) in the above table and short-run aggregate supply is shown in columns (1) and (4) in the above table.What will be the equilibrium level of real GDP and the equilibrium price level?
(b) Suppose in Year 2, aggregate demand changes and is now shown in columns (1) and (3).What will be the new equilibrium level of real GDP and the new equilibrium price level?
(c) Suppose in Year 3, aggregate demand changes and is now shown again in columns (1) and (2).What will be the new level of real GDP and the new price level if prices and wages are completely flexible downward?
(d) Suppose in Year 3, aggregate demand changes and is now shown again in columns (1) and (2).What will be the new level of real GDP and the new price level if prices and wages are completely inflexible downward?
Filters
- Essay(0)
- Multiple Choice(0)
- Short Answer(0)
- True False(0)
- Matching(0)